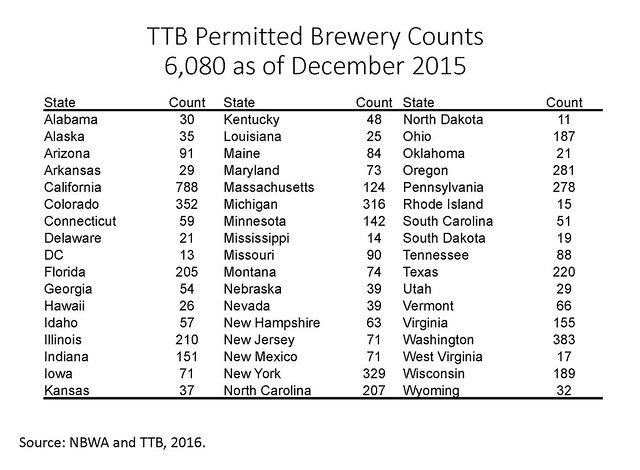
Some very interesting analysis from the NBWA, and their economist Lester Jones, about the number of breweries in America. Lester’s analysis uses slightly different metrics from the TTB and doesn’t define craft breweries as narrowly as the BA, and also the TTB doesn’t distinguish exactly what mat beverages are being made, if they’re licensed as a brewery then they’re included in the data. Those difference in calculating show the NBWA’s number for how many breweries there in America is 4,824, or over 550 more. But even more remarkable is that based on the number of “permitted breweries on record” at the TTB by the end of last year, that number could swell beyond 6,000, which seems absolutely crazy. The number is California alone, at 788, is just shy of 800. Sheesh!

Here’s the entire analysis below since the whole summary is worth reading:
Each year, the NBWA requests data from the TTB on tax paid withdraw volumes by size of brewery. Once again, this year’s TTB data provides some interesting brewing industry insights into the dynamics of the U.S. brewing industry. This data also is helpful for us to supplement the Brewers Association data on overall independent craft beer growth and brewery count. According to the BA, craft brewer volumes grew by 13 percent to 24.5 million barrels in 2015. The BA also reported 4,269 total operating breweries for 2015. As with all statistics, how the numbers are collected and reported can vary across organizations. In our industry, the numbers also change quickly.
As of April 2016, the U.S. domestic brewing industry had 4,824 reporting breweries according to the TTB. As with the BA’s brewery count of 4,269, this number is expected to change as additional new brewers are counted that may not yet have been fully recognized and/or reported by either the TTB or the BA data. The data presented below is for all types of malt beverage manufacturers and recognizes only the individual facility, not the ownership or control group.
Highlights from the 2015 TTB brewery count data include:
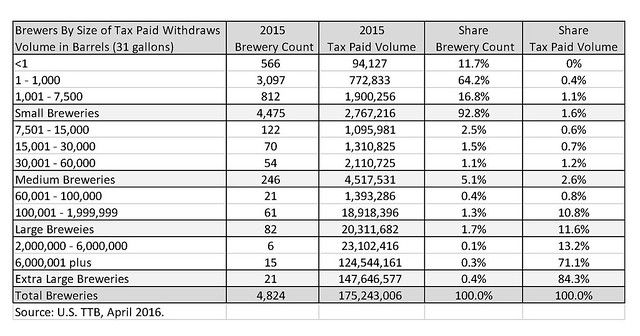
- The small brewer group (making less than 7,500 barrels) accounted for less than 2 percent of all domestic volumes yet accounted for 93 percent of all breweries. The smallest of this group has 566 breweries reporting less than one barrel of production each in 2015. These super small brewers can thank the contracting brewing industry for helping them sell almost 100,000 barrels – a figure well beyond their reported production capacity.
The medium brewer group (making between 7,501 and 60,000 barrels) is a much smaller group consisting of 246 breweries, but these few breweries account for 1.6 times more volume than the 4,475 breweries in the small brewer group. - The large brewer group consists of only 82 breweries making between 60,001 and 1.9 million barrels. This is a unique group within the industry as they pay the mixed rate federal excise tax of $7 for the first 60,000 barrels and $18 on each barrel over 60,001. While a much smaller group of only 82 breweries, they collectively produce more than four times the amount of beer as the medium brewer group. The large brewer group also has the largest range of production volumes and saw the fewest number of new entrants (17 breweries) into its ranks in 2015.
- Finally, we get the extra-large group. This is a group of only 21 breweries that produce more than 84 percent of all domestic beer – more than five times the amount made by all 4,803 combined. The closing of the MillerCoors brewery in Eden, North Carolina, will reduce this class of brewers by one in future reports and will take a significant-sized brewery offline for the first time in many years.
- The industry added around 1,500 new breweries in 2015 – that is equivalent to four new breweries a day entering the marketplace. As a highly capital-intensive business, starting small is the name of the game. Growing a beer brand takes a long time, and economies of scale are earned over decades. The largest U.S. breweries have been in operation for decades, and economies of scale should help maintain the beer volumes even in the face of declining per capita beer consumption.
- With more than 6,000 permitted breweries on record at the end of CY 2015, 2016 is set to be an even more competitive year for the brewing industry. Just as economies of scale drive the brewing side of the industry, logistical expertise and local market insights drive the efficiencies inherent in beer distributor networks. Working together and maximizing their comparative advantages, brewers, distributors and retailers will deliver unprecedented choice and value to American beer consumers in 2016.