

![]()
The California Board of Equalization — our taxing agency — yesterday sent out a press release with the results of a study they did on drinking trends in the state based on the collection of excise taxes. The release, Under the Influence of Recession: BOE Answers the Question, “Do People Drink More During an Economic Downturn?” is available as a pdf from the BOE’s newsroom page.

Below is the press release, which reports the overall findings:
There are no consistent patterns in alcohol consumption or spending on alcohol during recessions, a report released today by Board of Equalization (BOE) Chairwoman Betty T. Yee concludes.
The November 2010 edition of the BOE’s Economic Perspective newsletter looks at alcohol consumption data during the recessions of 1970, 1973, 1980, 1981, 1990, 2001 and 2008. The Economic Perspective is a quarterly publication produced by the BOE that looks at economic factors of interest or that influence California economic activity. The November edition looks exclusively at the issue of alcohol consumption during the seven recessions of the last 40 years.
“Economic data compiled by the Board of Equalization contains a wealth of information for estimating revenue impacts and other analyses that serve the agency’s tax administration mission,” said Chairwoman Yee. “In this case, the figures do not indicate any generalized patterns of behavioral change in alcohol use during bad economic times.”
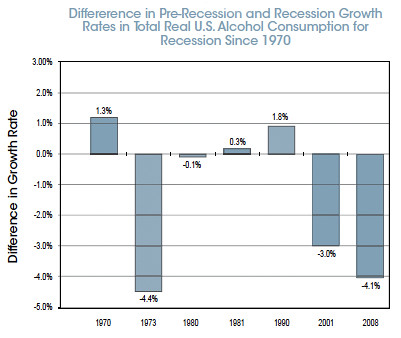
The BOE report notes several ways consumers would be expected to react during recessions: First, total alcohol consumption per capita may fall during the recession, as consumers would have less income to spend on alcohol. Second, consumers may substitute less expensive brands of alcohol for more expensive brands or less expensive ways to consume alcohol for more expensive ways, such as more off-premises consumption during recessions, as opposed to in bars and restaurants. Third, consumers may change the kind of alcohol they drink, for example switching from distilled spirits to less expensive alternatives such as beer. The fourth response, based on psychology more than economics, would be that consumers “drink away their sorrows,” and increase alcohol consumption during recessions. The data show examples of all four kinds of responses during recessions. The most consistent response, occurring in four of the seven recessions studied, was lower growth in on-premises alcohol consumption.
The November Economic Perspective also notes that in terms of national spending patterns on alcohol, prior to the 2008-09 recession total U.S. spending rose 2.4 percent. In contrast, during the 2008-09 recession, U.S. spending on alcohol declined by 1.7 percent.
The Economic Perspective newsletter also notes:
- Alcohol consumption nationally is at a 25-year high, based on a Gallup survey released in the summer of 2010, with 67 percent of Americans drinking alcohol.
- Federal Health and Human Services data show a low of 1.96 gallons ethanol consumption per capita in 1954 (a recession year) and a high of 2.76 gallons in both 1980 and 1981 (both of which were recession years).
- The data show that California alcohol consumption has generally followed national trends in the last 20 years. California per capita consumption, like the U. S., reached a low point in 1998, then started gradually trending upward.
The report points out that historical data show that when confronted with a recession, people who drink alcohol have responded in a variety of ways.
Various Responses Represented in Recessions
The data show examples of all four kinds of responses during recessions. The first consumer response, less growth in total alcohol spending, occurred in 1973, 2001, and 2008. Chart 3 shows these changes in total alcohol spending for each recession. The second kind of response, lower growth in on-premises alcohol consumption, occurred in the recessions that started in 1973, 1980, 1981, and 2008. This appears to be the most consistent response, happening in four of the seven recessions.The third response was seen in both of the 1970s recessions. Beer consumption went up in the recessions of the 1970s, while distilled spirits consumption went down. This kind of response has not happened since the 1970s. And the fourth response, significantly higher total alcohol spending during a recession, happened in 1970 and 1990.

And here’s some interesting tidbits from the Economic Perspective newsletter:
Average total U.S. ethanol consumption per capita is tabulated by decade in [the chart below] to track long-term trends. As shown in the chart, average ethanol consumption per capita for the first nine years of the first decade of 2000 was similar to that of both the 1960s and the 1990s. The recent decades with the highest consumption were the 1970s and the 1980s.

And here’s some more from the newsletter on alcohol and the economy.
U. S. Alcohol Drinking rate at 25-Year High
A Gallup survey released in the summer of 2010 indicated that 67 percent of Americans drink alcohol, the highest percentage recorded since 1985.1 Is there some kind of statistical relationship between alcohol consumption and economic growth? Do people drink more during recessions and associated periods of high unemployment rates?
Do We Drink More During Recessions?
To answer this question, this article reviews long term and short term trends in alcohol consumption and analyzes changes before and during the recessions we have had since World War II.
According to Gallup:Despite some yearly fluctuations, the percentage of Americans who say they drink alcohol has been remarkably stable over Gallup’s 71 years of tracking it. The high point for drinking came in 1976-1978, when 71 percent said they drank alcohol. The low of 55 percent was recorded in 1958. When Gallup first asked Americans about drinking, in the waning days of the Great Depression in 1939, 58 percent of adults said they were drinkers.Gallup reports also note that the percentage of Americans who say they drink alcohol has been in the low 60s fairly consistently since 1947.
Gallup Data Show Alcohol Use Unrelated to Recessions
Based on these data, it would appear that prior to 2010 there was little, if any relationship between the percentage of people drinking and economic conditions. The economy was not in a recession during the 1976-1978 period, when the highest percentage of adults defined themselves as alcohol drinkers (71 percent). In fact, the economy was growing rapidly, with real gross domestic product (GDP) increasing an average of 5.2 percent per year during this three-year period. This is well above the 2.9 percent average annual growth rate experienced by the U.S. economy since 1945. The economy was in a recession from August 1957 through April 1958, about the time of the lowest percentage of adult drinking in Gallup’s records (55 percent).2 If anything, these extreme points in the Gallup poll results seem to indicate that people drink more when the economy does
Other Measures of Alcohol Consumption
Polls such as those done by the Gallup Group measure how prevalent drinking is. Other measures indicate how much alcohol is consumed. These include ethanol (pure alcohol) content, gallons of liquid by type of product, and spending in dollars.
Health and Human Services Alcohol Surveillance Reports
The U.S. Department of Health and Human Services (HHS) periodically does surveillance reports of state and national alcohol consumption in terms of gallons of ethanol content of beer, wine, and distilled spirits per capita for those over age 14. Sources of data include state government revenue agencies and various industry sources. The most recent HHS report has these annual data from 1934 through 2008.3 The data show no obvious correlations with recessions. For example, in 2001 (the most recent recession covered by these data) total U.S. ethanol consumption from beer, wine, and distilled spirits was 2.18 gallons per capita,
Alcohol Consumption Rising Since 1998
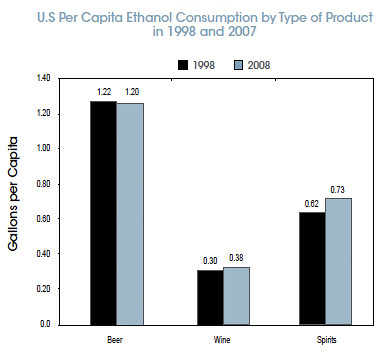
The HHS data show that total U.S. ethanol consumption reached its most recent low point in 1998, at 2.14 gallons per capita. It has been slowly trending upward since then, reaching 2.32 gallons per capita in 2008. As shown in Chart 1, wine and distilled spirits were responsible for the increase in U.S. per capita consumption from 1998 to 2008.
Lowest and Highest Alcohol Consumption
The lowest U.S. total ethanol consumption since the end of World War II was 1.96 gallons per capita in 1954 (a recession year, with a recession running from July 1953 through May 1954). The highest consumption was 2.76 gallons per capita in both 1980 and 1981 (both recession years, each with six-month periods of recessions).
On additional interesting findings is that during a recession, they did note that people tend to go out less frequently, meaning sales of alcohol at restaurants and bars decline, but based on the uptick in retail purchases of alcohol for home consumption it’s essentially a wash. But that means, as we’ve seen brewpubs and restaurants struggle a bit while package craft and regional breweries have had solid growth.
The BOE study concludes that “there appear to be no consistent patterns in alcohol consumption or spending during recessions. Recessions are all different; some last longer than average, some are associated with more than average job losses. Alcohol consumption responses during recessions are also different, and not very predictable. The historical data show that when confronted with a recession, people who drink alcohol have responded in a variety of ways.”