![]()
Last week I shared some of the highlights from the Brewers Association‘s bi-monthly Power Hour session that Ray Daniels tweeted about throughout the hour, whose topic was “Craft Brewing & Mid-Year Category Sales Review.” As a BA member, I also was able to look at the presentation after the fact and — with the Brewers Association’s permission — thought I’d share some more of the interesting statistics that SymphonyIRI revealed during their presentation.
During the First Half of 2010 …
- Craft showed double-digit growth in all five types of stores that IRI tracks: Grocery (up 11.9% vol./13.2% $), Drug Stores (24.5%/25.3%), Convenience Stores (11.1%/13.3%), Liquor Stores (24.2%
/20.9%) and Big Box Stores (33.3%/34.1%) - Craft 6-pack cans were up 80% and 12-packs were up 49.4%
- 7 of the Top 15 new brands were Alcopops
- Craft is up 13.2% $ vs. total beers sales up only 0.1%
- Total Beer Sales minus Craft was down -1.0%
- The #1 craft brand was Sierra Nevada Pale Ale, slightly edging out Samuel Adams Boston Lager.
- The craft mix is more diversified; the top 10 craft brands account for 41% of the craft total, whereas the top 10 imports account for 68% and the top 10 macro brands 73.5%.
- California, by volume, sold more beer than any other state, and in fact sold nearly twice as much as the next highest state, which was Washington.
- Craft has a more than 20% market share of three key markets:
- Portland, Oregon (29.9%)
- Seattle/Tacoma, Washington (24%)
- San Francisco/Oakland, California (20.3%)
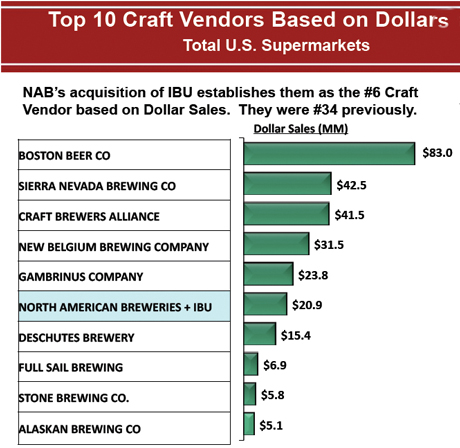
And here’s a couple of graphs. The first shows the top ten craft brewing companies, with craft being defined more broadly by SymphonyIRI than the BA’s definition. Significantly, it shows that the purchase of Magic Hat/Pyramid/Portland breweries by North American Breweries catapulted them from #34 to #6.

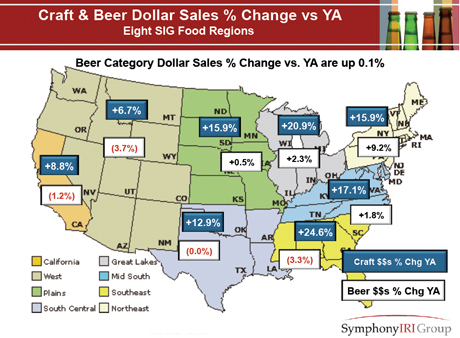
The second compares sales by dollars between craft beer (in blue) and macro brands (in white) and divided by region of the country. The Southeast (24.6%) followed by the Great Lakes states (20.9%) experienced the greatest growth over last year. The big breweries saw their sales dip the most in the West (excluding California, at -3.7%) followed by the Southeast (-3.3%). Big brands actually had pretty good growth (9.2%) in the Northeast, though craft in that region was 15.9%, making it the third-highest region (along with the Plains states).


Hi Jay,
Interesting that “The #1 craft brand was Sierra Nevada Pale Ale, slightly edging out Samuel Adams Boston Lager”, while the chart shows sales of Boston Beer company to be twice that of Sierra Nevada.
Is there any data that shows how these two companies break down in terms of brands?
Brian
Sort of. I suspect the reason is that while Sierra is #1 in the Top 15, their Seasonals are #9 and Torpedo is #11. Boston Beer, by contrast, in addition to the #2 spot with Boston Lager also has #3 with Samuel Adams Seasonals (and the dollar difference between #2 and #3 is very small. Combining 2 and 3 would nearly double the sales of Sierra Nevada Pale Ale). But then in addition, Samuel Adams Variety Pack is #6 and Sam Adams Light is #8.
Jay, are you sure that last map shows craft sales (blue) vs. macro sales (white)? Looks like the key says the white boxes are just “beer” — is it understood that when IRI says this they mean beer minus craft, or does this actually refer to the beer industry as a whole, as appears to be the case?
Brad, I’m afraid I don’t remember that far back. It’s certainly possible I made that mistake, but I’ll have to see if I can access the original data to get you an answer. Cheers, J