

Here’s another interesting set of data from the curiously named Floating Sheep, this one regarding The Beer Belly of America. Essentially, what they did was “a simple comparison between grocery stores and bars.” They anticipated that they’d find more grocery stores than bars, and that did prove to be true. But they were surprised to find what they termed the “‘beer belly of America’ peeking out through the ‘t-shirt of data.'”
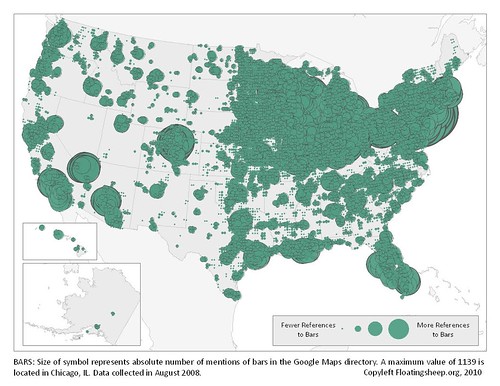
In this chart, the size of the green symbols represents the number of mentions of bars in the Google Maps directory. To see it full size, click here. Chicago, Illnois had the highest number.
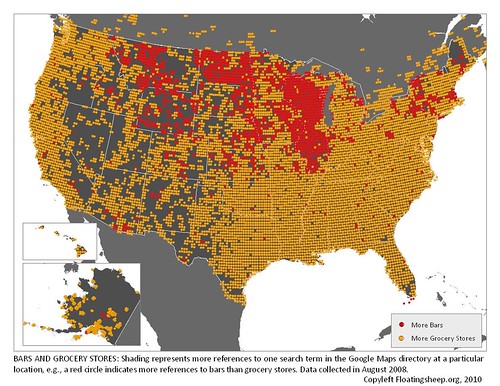
In the chart below, yellow dots are area where they found more mentions of grocery stores and the red dots indicate where they found more bars. And while there are red dots … well, dotting the whole nation, there does seem to be a definite concentration of red from Wisconsin/Illinois west to Idaho. That’s the area they refer to as The Beer Belly of America.
To see it full size, click here.
They also compiled a list of each state and the number of bars per 10,000 people. I don’t know what it means that the top seven states were all within the The Beer Belly of America.
- North Dakota 6.54
- Montana 6.34
- Wisconsin 5.88
- South Dakota 4.73
- Iowa 3.73
- Nebraska 3.68
- Wyoming 3.4
I’m also not convinced that this type of per capita statistics are that useful. Because of economies of scale, it seems that states with less people always do better in per capita comparisons. The same thing happened when looking at per capita brewery distribution by state, with perhaps the exception of Oregon.
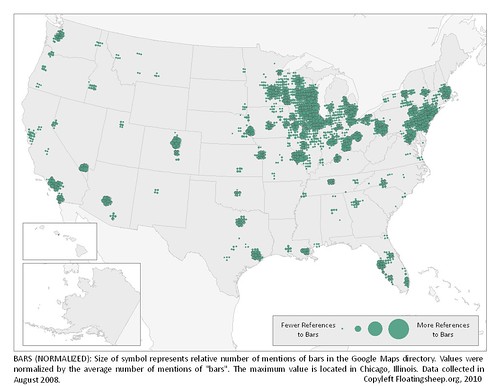
The final chart is similar to the first, but shows the number of bars “normalized” based on the average number of mentions for all locations. That means that where you see color are the places where there were mentions of bars exceeding the average. In this view, it’s easier to see where there are more bars, or at least more Google Maps mentions of them.
To see it full size, click here.
This is a monumentally great post Jay! Now we need to overlay Belgian beer on those maps to get a list of the top places people want to live!