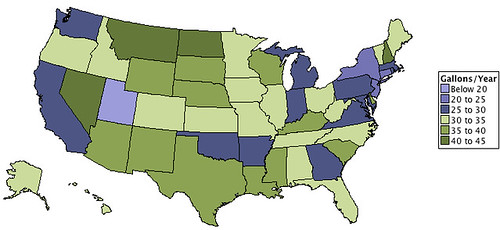
Today’s infographic shows Annual Beer Consumption Per State Per Capita, based on data from 2009. It was created to answer the question of whether or not there “is there a link between climate and beer consumption?” If you’ll pardon the pun, the results seem allover the map, so I’d have to conclude that the answer is “no.”


For sure Nevada’s skewed upward because it’s free when you’re gambling @ the casinos; what I would find more relevant is the relation btwn the retail price of liquor, average annual income, & beer consumption. For sure, CA has some of the cheapest liquor prices in the US (DC, MD, FL, NV,& KY are better than most of the other 30+ states I’ve been to; WA & OR are 50% higher). Beer’s always been the cheapest form of alcohol, fortified wine’s the next cheapest “buzz for the buck” after the malt liquors that the skid row denizens favor. Whatever – an interesting graphic.