
Well I can’t say that seems to be the case from my personal experience, but a new Gallup Poll is being spun that way, especially in an Atlantic article, Why Are American Drinkers Turning Against Beer? This particular Gallop Poll is done each year — since at least 1939 — and what you have to remember is that it’s a popularity poll, not necessarily a scientific one. The poll itself is conducted in a proper manner, but it’s asking people to “say what they drink” or “what they prefer.” And that’s far different from what the actual sales indicate. The last time I wrote about this was in 2010, when that year the Latest Gallup Poll Reveals Drinking At 25-Year High With Beer #1.
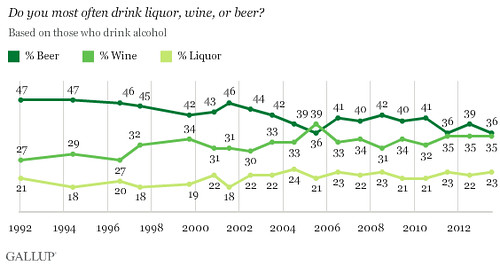
This year, the big story is “per capita consumption of beer down 20 percent,” as is overall production of beer. But as they continue to lump all beer together, when clearly patterns of drinking beer are changing, by keeping the poll simple they miss some of what’s really going on.
As my “beer brother” Lew Bryson commented. “Craft beer has been on a tear since 2002; latest figures have it up 15% annually (volume, 17% on $ sales). Volume sales of the majors are down, and trending downward steadily. Wine and spirits are picking up some of that, but craft is picking up a good share. It’s also worth noting that this IS a ‘what do you like’ poll, not ‘how much do you drink’ sales numbers. Beer still wins that by a sizable margin, both on volume and $ sales.” True indeed, when I wrote about this in 2010, beer outsold beer 4 to 1, showing just how skewed the difference is between what people say they like to drink, and what they actually drink.
One curious thing I wonder about these polls, and other alcohol data generally, is why alcohol is always divided up into these three tidy boxes? And where in these categories, if anywhere, is captured the sales, preferences or what-have-you for cider, alcopops, sake and other beverages that don’t seem to fit neatly into one of the big three. Are they ignored, or lumped into one of the three? It’s seems a fairly relevant question, since cider’s on a big upswing and alcopops have had their ups and downs, but certainly have to be part of the equation, especially when it comes to the all-important 18-29 demographic. But not even the full report gives any additional clues.
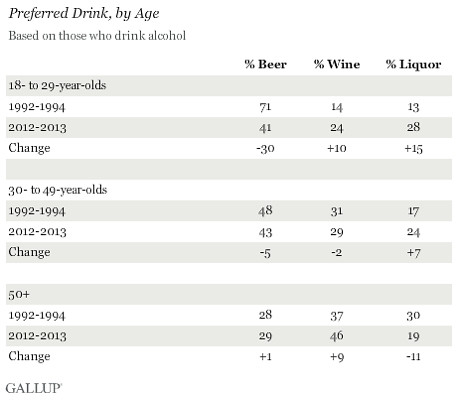
Another item that makes me question Gallup’s polling is the huge gains of bottled water. To me that has more to do with availability than anything else. It’s getting harder and harder to even find a water fountain these days, because business has figured out that people will pay for it when that have no choice.
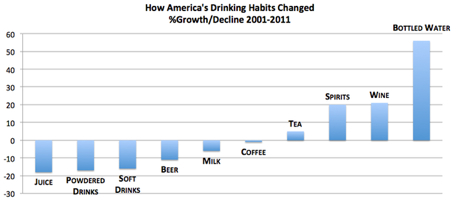
Another explanation that didn’t ring true was that “American drinkers are more health-conscious today” and that’s led to people choosing other beverages, but even the author admits that this “does not adequately explain why Americans would turn against light beer,” as if that really is a healthy alternative. As I’ve said endlessly, low-calorie diet beer is hardly any healthier than non-light beers so that argument doesn’t hold any water … or even any watered-down beer.
Happily, the day after this story ran on the Atlantic’s website, the same author posted The Death of Beer Has Been Greatly Exaggerated, in which Derek Thompson shows that, despite the Gallop Poll, “total U.S. spending on all alcoholic beverages — both at home and at restaurants and bars — is up 27 percent since 1980 and even more since the mid-century.”
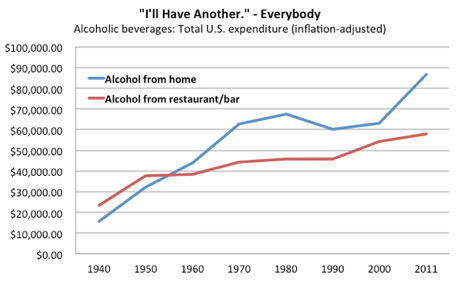
And as I mentioned earlier, beer currently still outsells wine by a significant margin, and his data also indicates that “beer volume still outsells wine volume by 8.5” times! So it’s pretty hard to swallow once more that beer is on the ropes.
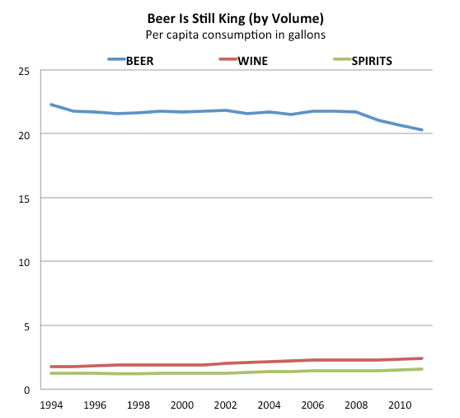
Thompson sums up his two days worth of articles:
The total amount of beer consumed by Americans is in structural decline, and there are more wine-drinkers than there used to be. But beer is still the most popular boozy beverage in America and overall sales are holding up, thanks in part to the emergence of craft beers.
Did we really need another Gallop Poll or Atlantic business writer to tell us that?

Thanks for taking on these articles, Jay – while the first was odd (tho better than some of the other coverage of the Gallup poll :::cough:::Slate:::cough:::) and the second less so, they need a little attention. What I find interesting is that the poll got as much press as it did this year: why is “beer’s decline” such an attractive topic to so many sources at this moment? Hmm.
And you bring up an important point about this poll in questioning ‘why no cider, alcopops, etc.’ Gallup’s kind of stuck between a rock and hard place on this one. On the one hand, the questions they’re asking may not be quite as useful as they once were. However, if they change the questions at all, they can’t accurately compare the data to previous years. So it’s either keep asking less-and-less comprehensive questions OR ask a better question and lose all ability to compare the findings. And let’s be honest, the latter isn’t an option.
IMO, the most striking aspect of this year’s poll is that the lines are converging for most of the demographic groups provided (this time Gallup only gave gender and white/nonwhite split – sometimes they give much more, down to regions and more specific racial identifiers). That is, the popularity of a group’s “preferred” beverage-type 20 yrs ago declined over the period, while the least-favorite became more popular. All except for that huge swath of the American population: women, who prefer wine by a greater margin than ever before, and stated “I drink beer most” even less often than they did 20 years ago. (The same is true, apparently, of drinkers over 50, I believe.) Not sure it takes a genius to explain that one – but who’s gonna do something about it?