
Today’s infographic is actually a series of U.S. maps from SAMHSA (the Substance Abuse and Mental Health Services Administration), a government agency created in 1992. The series of maps breaks down various aspects of Alcohol Use, by state. And the source of all of the data is “SAMHSA, Office of Applied Studies, National Survey on Drug Use and Health, 2004 and 2005.”
Alcohol Use in Past Month among Persons Aged 12 or Older
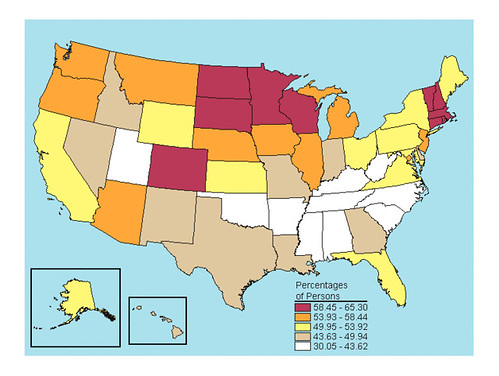
Alcohol Use in Past Month among Youths Aged 12 to 17

Alcohol Use in Past Month among Persons Aged 18 to 25
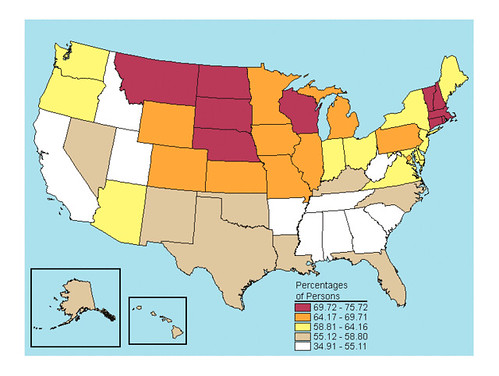
Alcohol Use in Past Month among Persons Aged 26 or Older
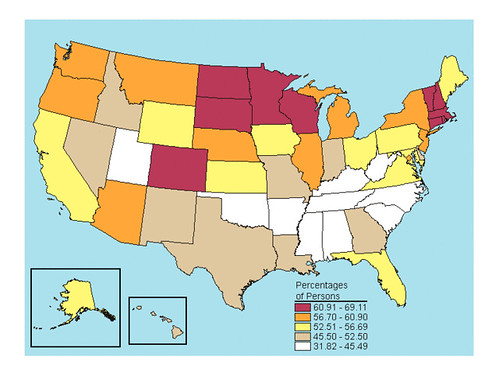
Binge Alcohol Use in Past Month among Persons Aged 12 or Older
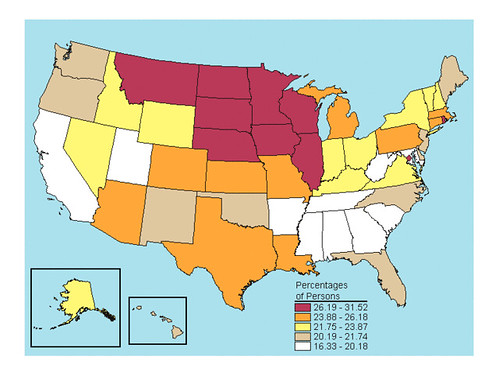
Binge Alcohol Use in Past Month among Youths Aged 12 to 17

Binge Alcohol Use in Past Month among Persons Aged 18 to 25

Binge Alcohol Use in Past Month among Persons Aged 26 or Older
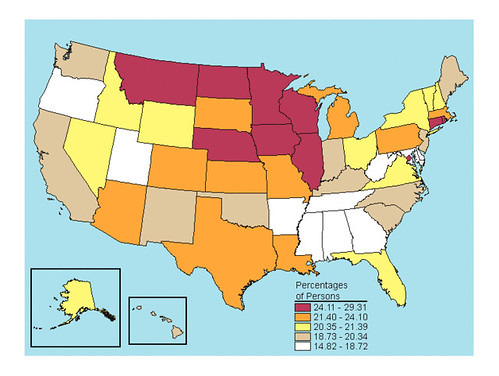
Perceptions of Great Risk of Having Five or More Drinks of an Alcoholic Beverage Once or Twice a Week among Persons Aged 12 or Older
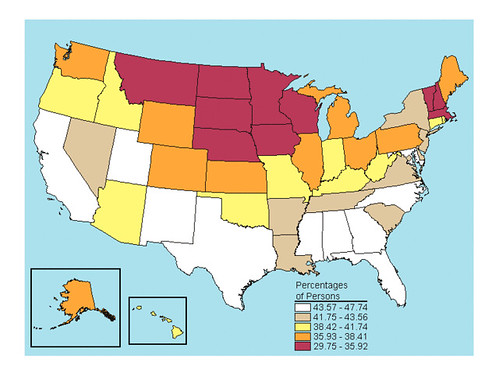
Perceptions of Great Risk of Having Five or More Drinks of an Alcoholic Beverage Once or Twice a Week among Youths Aged 12 to 17
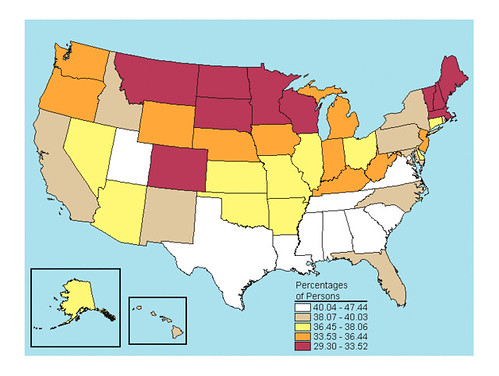
Perceptions of Great Risk of Having Five or More Drinks of an Alcoholic Beverage Once or Twice a Week among Persons Aged 18 to 25
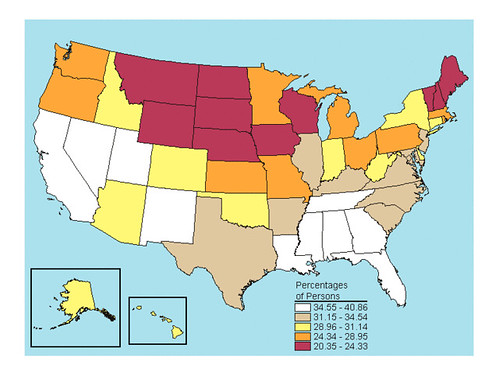
Perceptions of Great Risk of Having Five or More Drinks of an Alcoholic Beverage Once or Twice a Week among Persons Aged 26 or Older

To see all of the maps full size, go here, where you can also see a write-up of them.

Interesting – loox like the Marin Institue should move to the Badlands – LOL