Brookston Beer Bulletin

Jay R. Brooks on Beer

  • Home
  • About
  • Editorial
  • Birthdays
  • Art & Beer

Socialize

  • Dribbble
  • Email
  • Facebook
  • Flickr
  • GitHub
  • Instagram
  • LinkedIn
  • Pinterest
  • RSS
  • Twitter
  • YouTube

Powered by Genesis

You are here: Home / Beers / Effects of Alcohol At Different BAC Levels

Effects of Alcohol At Different BAC Levels

October 9, 2010 By Jay Brooks

bac-chart
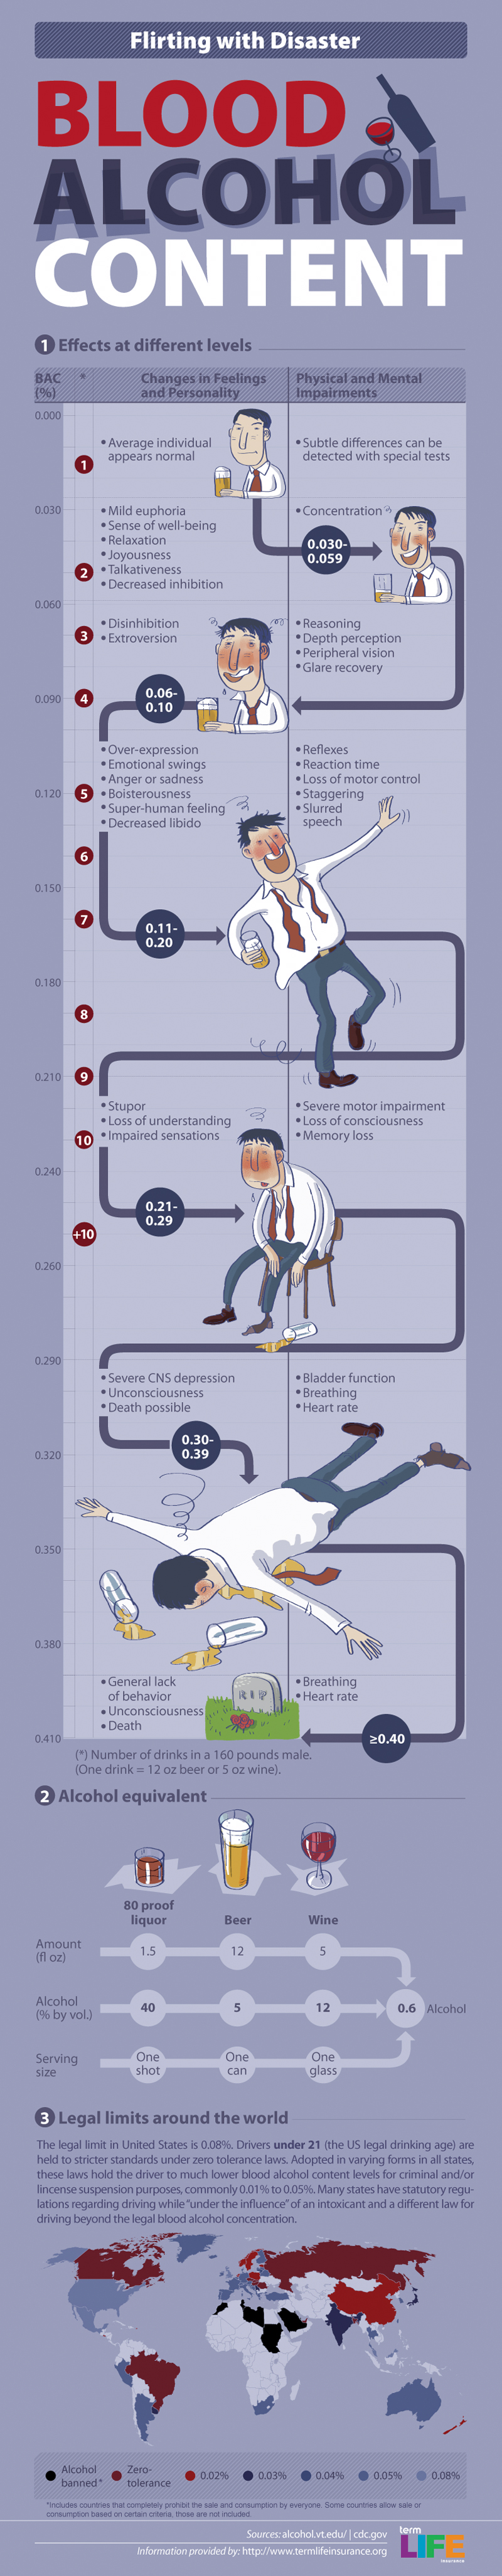
Here’s another interesting infographic created by, of all people, a Term Life Insurance website, showing The Impact of Alcohol on your Body as your blood-alcohol content percentage increases.

bac-graphic

Filed Under: Beers, Just For Fun, Politics & Law Tagged With: Infographics, Science, Statistics


Comments

  1. Steve A. says

    October 9, 2010 at 3:48 pm

    Why does the chart indicate in part 2 that one beer equates to 0.6% alcohol?? Shouldn’t that be closer to 0.06%?

    • Harry says

      October 10, 2010 at 12:10 pm

      The 0.6 on part 2 of the chart refers to 0.6 ounces of alcohol. This translates to about .02% BAC for body weight of 160 pounds.

Find Something

Northern California Breweries

Please consider purchasing my latest book, California Breweries North, available from Amazon, or ask for it at your local bookstore.

Recent Comments

  • Amanda Alderete on Beer Birthday: Jack McAuliffe
  • Aspies Forum on Beer In Ads #4932: Eichler’s Bock Beer Since Civil War Days
  • Return of the Session – Beer Search Party on The Sessions
  • Scoats on Beer Birthday: Scoats
  • You're Not From Around Here - Food GPS on The Sessions

Recent Posts

  • Beer In Ads #4983: Refresh Yourself With Delicious Bock Beer May 28, 2025
  • Historic Beer Birthday: John the Fearless May 28, 2025
  • Historic Beer Birthday: Charles Green May 28, 2025
  • Beer In Ads #4982: Wiener Bock Beer May 27, 2025
  • Beer Birthday: Shaun Hill May 27, 2025

BBB Archives

Go to mobile version