Brookston Beer Bulletin

Jay R. Brooks on Beer

  • Home
  • About
  • Editorial
  • Birthdays
  • Art & Beer

Socialize

  • Dribbble
  • Email
  • Facebook
  • Flickr
  • GitHub
  • Instagram
  • LinkedIn
  • Pinterest
  • RSS
  • Twitter
  • YouTube

Powered by Genesis

Beer Efficiency Score

May 10, 2013 By Jay Brooks

strong-beer
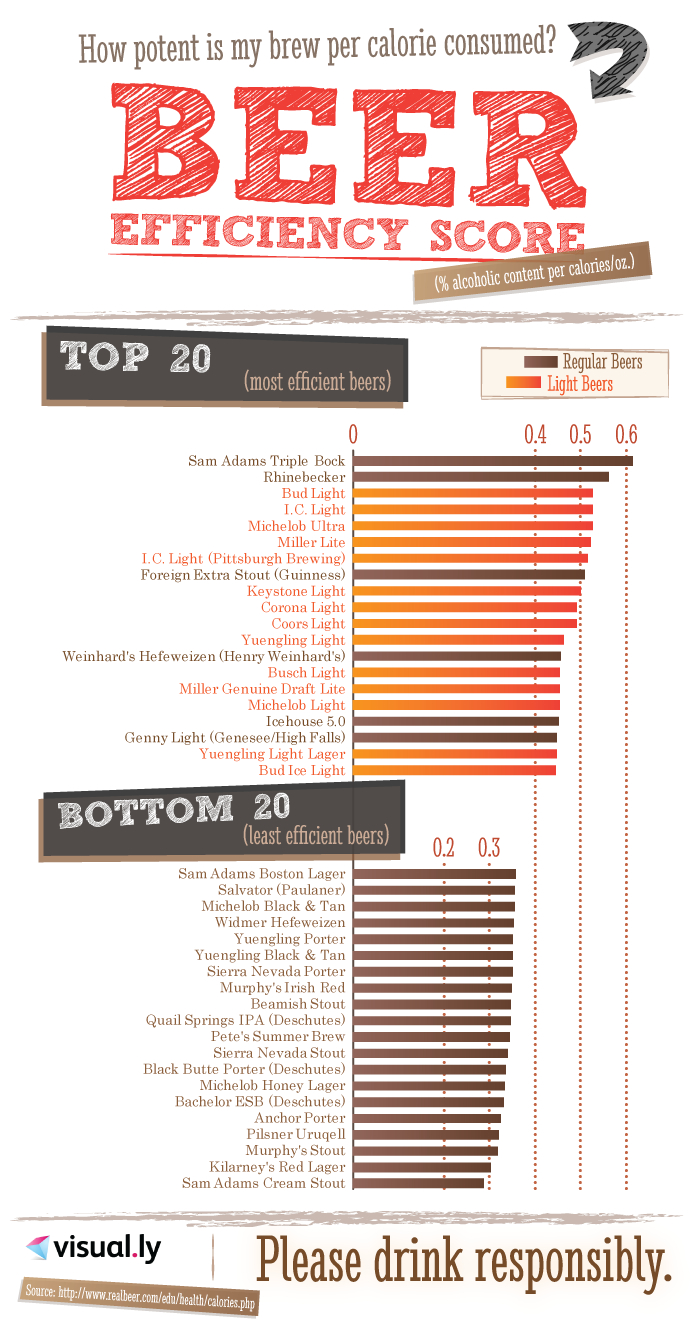
Today’s infographic is an odd one. Entitled Beer Efficiency Score, they mean “How potent is my brew per calorie consumed?” It’s a rather dubious measure of a beer, but interesting that someone would go to the trouble to figure it out.

Beer-Efficiency-Score
Click here to see the chart full size.

Filed Under: Beers, Just For Fun Tagged With: Extreme Beer, Infographics, Science of Brewing

What’s Wrong With My Beer?

April 28, 2013 By Jay Brooks

beer-defects
Today’s infographic is another one from CraftBeer.com, the Brewers Associations consumer website. This one, an article entitled When Craft Beer Goes Bad, was penned by Andy Sparhawk, and included this infographic showing common beer defects and their possible cause.

whats-wrong
Click here to see the infographic full size.

Filed Under: Beers, Just For Fun Tagged With: Brewers Association, Infographics, Science of Brewing

How Ales & Lagers Are Fermented

April 25, 2013 By Jay Brooks

brewery-tanks
Today’s infographic is How Ales & Lagers are Fermented, and though I don’t know who created it, I found on Planet Beer. The illustration shows some of the basic differences in the brewing process between ales and lagers.

ales-and-lagers
Click here to see the illustration full size.

Filed Under: Beers, Just For Fun Tagged With: Brewing Equipment, Infographics, Science of Brewing

Beer Balance Value: Bitterness Units To Gravity Units

April 10, 2013 By Jay Brooks

home-brewing-graphic
Today’s infographic is a homebrewing chart showing the balance value of different types of beer based on their bitterness units and their gravity units. It was created by a homebrewer and posted on his own personal homebrewing website.

bvchart
Click here to see the chart full size.

Filed Under: Beers, Just For Fun Tagged With: Homebrewing, Infographics, Science of Brewing

When To Brew

April 3, 2013 By Jay Brooks

calendar-1
Today’s infographic is a simple chart of when is the best time to brew certain types of beer, as suggested by Barley & Vine, a homebrew store near Atlanta, Georgia.

WHen-to-Brew
Click here to see the chart full size.

Filed Under: Beers, Just For Fun Tagged With: Homebrewing, Infographics, Science of Brewing

Beer: The Process

March 28, 2013 By Jay Brooks

beer-ingredients
Today’s infographic shows Beer: The Four Process, done as part of a series of posters by “The Bone Collector,” a 20 year old graphic designer from Brisbane, Australia.

beer-the-process
Click here to see the poster full size.

Filed Under: Beers, Breweries, Just For Fun Tagged With: Infographics, Science of Brewing

Beer: The Ingredients

March 27, 2013 By Jay Brooks

beer-ingredients
Today’s infographic shows Beer: The Four Ingredients, done as part of a series of posters by “The Bone Collector,” a 20 year old graphic designer from Brisbane, Australia.

beer-the-ingredients
Click here to see the poster full size.

Filed Under: Just For Fun Tagged With: barley, Hops, Infographics, Malt, Science of Brewing, Water, Yeast

Alcohol Ranges By Style

March 25, 2013 By Jay Brooks

ethyl-alcohol
Today’s infographic is another one from Lug Wrench, this one all about Alcohol By Volume Ranges By Style, showing the BJCP styles with the range of a.b.v. for each.

ABV-Chart
Click here to see the chart full size.

Filed Under: Beers, Just For Fun Tagged With: Infographics, Science of Brewing

Are Hops Addictive?

March 23, 2013 By Jay Brooks

hops
Are Hops Addictive? I sure hope so. PopSci’s BeerSci series tackles that very question in an interesting article: Are Hops Addictive? So what’s the answer? I’m not telling, but don’t worry. The answer is a click away.

Lupulin-Threshold-Shift

Filed Under: Beers, Just For Fun Tagged With: Hops, Science, Science of Brewing

Ninkasi Brewing Process

March 14, 2013 By Jay Brooks

beer-ingredients
Today’s infographic shows the brewing process at Ninkasi Brewing in Eugene, Oregon. I’ve seen a lot of these diagrams, and even started collecting them this year in a Tumblr, Visualize Brewing, but this is one of the coolest ones I’ve seen. The detail is great, which you can see better looking at it full size.

Ninkasi
Click here to see the poster full size, and you can also download a pdf of it at the Ninkasi website.

Filed Under: Breweries, Just For Fun Tagged With: Infographics, Science of Brewing

« Previous Page
Next Page »

Find Something

Northern California Breweries

Please consider purchasing my latest book, California Breweries North, available from Amazon, or ask for it at your local bookstore.

Recent Comments

  • Ernie Dewing on Historic Beer Birthday: Charles William Bergner 
  • Steve 'Pudgy' De Rose on Historic Beer Birthday: Jacob Schmidt
  • Jay Brooks on Beer Birthday: Bill Owens
  • Steve 'Pudgy' De Rose on Beer Birthday: Charles Finkel
  • Steve 'Pudgy' De Rose on Beer Birthday: Bill Owens

Recent Posts

  • Historic Beer Birthday: Johann Baier February 23, 2026
  • Beer In Ads #5125: Bowler Brothers’ Bock February 22, 2026
  • Beer Birthday: Fred Bueltmann February 22, 2026
  • Historic Beer Birthday: John Emmerling February 22, 2026
  • Beer In Ads #5124: Möerlbach Bock February 22, 2026

BBB Archives

Feedback

Head Quarter
This site is hosted and maintained by H25Q.dev. Any questions or comments for the webmaster can be directed here.