Brookston Beer Bulletin

Jay R. Brooks on Beer

  • Home
  • About
  • Editorial
  • Birthdays
  • Art & Beer

Socialize

  • Dribbble
  • Email
  • Facebook
  • Flickr
  • GitHub
  • Instagram
  • LinkedIn
  • Pinterest
  • RSS
  • Twitter
  • YouTube

Powered by Genesis

MADD Rates The States

November 17, 2011 By Jay Brooks

drunk-driving
According to a press release sent out by the neo-prohibitionist organization MADD yesterday, it’s the five-year anniversary of the launching of their Campaign to Eliminate Drunk Driving® program, which you can tell is all about the results since they went to the trouble to get a “registered trademark” on the name. I also find it somewhat ironic that an organization whose name is “Mothers Against Drunk Driving” has to start a side campaign within its organization to eliminate drunk driving. Isn’t that supposed to be their main purpose? It was, of course — once upon a time — but it’s moved so far from that simple idea now that it seems it’s almost an afterthought so that five years ago they had to create a new program to address the issue of drunk driving.

So yesterday they released the somewhat arrogantly-named “Report to the Nation, which rates each state on its progress toward eliminating drunk driving.” The news is just what you’d expect, indeed what it is every time. “[W]e’ve made substantial progress together, but there is still much work to be done.” And so it goes. Every time. They have to make progress, or why do they even exist, but there always has to be more to do, or else who would keep giving them money? That dichotomy creates contradictions that call all of their assertions into question. For example, on page 6 of the 32-page report, a splash page entitled “A New Hope,” the headline is “drunk driving fatalities reduced by almost half.” And that would certainly be good news, I don’t dispute that. Except that what they refer to as “remarkable progress” in the first paragraph morphs into something entirely different by the second paragraph, which begins: “Despite great progress, drunk driving fatalities have remained relatively stagnant since the mid-nineties, with roughly one out of three highway deaths caused by a drunk driver.” Now how exactly can fatalities be “reduced by almost half” while at the same time “remaining relatively stagnant?”

It’s a game, sadly. Non-profits may not care about profits the way corporations do, but that doesn’t mean they don’t care about money … a lot. They complain constantly about the money that alcohol companies spend on lobbying or influencing policy, but that’s exactly what these neo-prohibitionist groups do, too. Most non-profits may start out with the best of intentions, with a clear goal in mind, but then seem to collapse under their own weight into money-sucking organizations nearly as bad as those they often rail against as they grow larger. In a sense, they become victims of their own success. They become “institutions,” with fixed costs, offices, salaries to pay, consultant fees, marketing materials, advertising, webmasters, etc. They need a lot of money just to take care of their day-to-day costs, never mind whatever they’re trying to achieve. MADD’s gone so far from their original intent that when my son was in kindergarten, he got a bookmark from them during “red Ribbon Week” so he’d know that drugs are bad. Never mind that he parroted that message the next time we tried to give him medicine when he was sick, not quite old enough to process that not ALL drugs were bad.

The “report” also floats yet another made up number of how much it all costs, this time that “drunk driving costs the United States more than $132 billion annually.,” similar to the CDC’s recent $223.5 billion figure, though that was for “excessive alcohol use,” not just driving. Their “research” was done by the Pacific Institute for Research and Evaluation (PIRE), and their figure “includes $61 billion in monetary costs, plus quality-of-life losses valued at $71 billion,” just as notoriously impossible to quantify as lost wages, though they did still try to include “crashes outside of work involving employees and benefit-eligible dependents.” The full study itself, however, is not included in the “report,” just a one-paragraph summary of it so I don’t know all of the particulars.

Another aspect of the report is about “turning cars into the cure,” which really means just “ignition locks,” one of the most invasive ideas ever implemented, especially for first-time offenders who do not constitute the bulk of the problem. What continues to bother me about this is that MADD, and the rest of the Anti-Alcohol bunch, continue to ignore supporting a much better solution, the technology to create cars that drive themselves. That technology is surprisingly close to becoming a reality, with several prototypes in various states of development and being tested. It would virtually eliminate not just drunk driving, but bad driving, texting and telephone issues while driving, and so much more. Just input the address of where you want to go into a computer and the car takes you there while you sit and watch. Instead, MADD seems to prefer technology that punishes. At a minimum, why not support both?

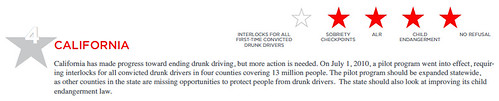
But the bulk of the “report,” around half of it, is their evaluations of how each state is doing to combat drunk driving, at least according to their criteria. They use a five-star scale, with each star representing whether the state does what MADD wants them to regarding the following:

  1. Interlocks for All First-Times Convicted Drunk Drivers
  2. Sobriety Checkpoints
  3. Administrative License Revocation
  4. Child Endangerment
  5. No Refusal

MADD-rating-states-map

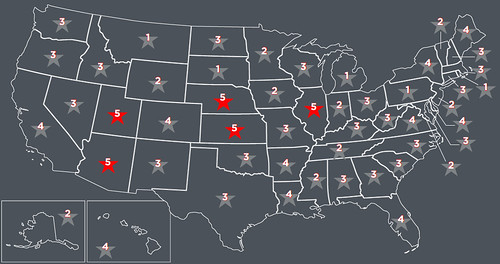
Five states got highest marks:

  1. Arizona
  2. Illinois
  3. Kansas
  4. Nebraska
  5. Utah

And like a good bell curve, five got just 1 (nobody got a zero):

  1. Michigan
  2. Montana
  3. Pennsylvania
  4. Rhode Island
  5. South Dakota

There’s also an interactive map where you can see how your state did. California, for example, got a surprising 4. I’m sure Alcohol Justice would disagree with that one.

MADD-rating-states-cal

The states that got a five are still, of course, encouraged to do more. And by more, MADD means for each state to accept what they think is the best approach. Do what we say, or risk a bad rating, that seems to be at least part of the message. With most states receiving a three, there’s plenty of room for improvement, and plenty of need for more fund-raising.

Filed Under: Editorial, News, Politics & Law Tagged With: Anti-Alcohol, Prohibitionists, Statistics

Fomenting Female Fear

November 16, 2011 By Jay Brooks

women
The purported scientific journal Alcoholism: Clinical and Experimental Research has just published another doozy, this one entitled The Legacy of Minimum Legal Drinking Age Law Changes: Long-Term Effects on Suicide and Homicide Deaths Among Women. The idea was to compare people drinking before the age was raised to 21 with when 18-year olds could still legally imbibe, but the conclusions are .. well, off the deep end and unnecessarily alarmist. So, of course, anti-alcohol groups are running with the results, just as you’d expect.

Despite it being in a “scientific journal” it appears to be nothing more than junk science. They start with this premise. “Prior to the establishment of the uniform drinking age of 21 in the United States, many states permitted legal purchase of alcohol at younger ages. Lower drinking ages were associated with several adverse outcomes, including elevated rates of suicide and homicide among youth.” Really? So the other 139 nations who allow people 18 or under are all killing their kids, getting them to commit suicide more often or generally simply not caring about their health. Most of the rest of the world allows their citizens to drink before they turn 21. Apart from the eight countries where it’s illegal for everyone — mostly for religious reasons — only a dozen countries are as high as 21 (only 5 according to Alcohol Problems & Conclusions), like us. Clearly, the rest of the world hates its kids, right?

Here’s the rest of the Abstract:

Methods:  Analysis of data from the U.S. Multiple Cause of Death files, 1990 to 2004, combined with data on the living population from the U.S. Census and American Community Survey. The assembled data contained records on over 200,000 suicides and 130,000 homicides for individuals born between 1949 and 1972, the years during which the drinking age was in flux. Logistic regression models were used to evaluate whether adults who were legally permitted to drink prior to age 21 were at elevated risk for death by these causes. A quasi-experimental analytical approach was employed, which incorporated state and birth-year fixed effects to account for unobserved covariates associated with policy exposure.

Results:  In the population as a whole, we found no association between minimum drinking age and homicide or suicide. However, significant policy-by-sex interactions were observed for both outcomes, such that women exposed to permissive drinking age laws were at higher risk for both suicide (OR = 1.12, 95% CI: 1.05, 1.18, p = 0.0003) and homicide (OR = 1.15, 95% CI: 1.04, 1.25, p = 0.0028). Effect sizes were stronger for the portion of the cohort born after 1960, whereas no significant effects were observed for women born prior to 1960.

Conclusions:  Lower drinking ages may result in persistent elevated risk for suicide and homicide among women born after 1960. The national drinking age of 21 may be preventing about 600 suicides and 600 homicides annually.

Okay, the first thing that should stick out is the statement that “[i]n the population as a whole, we found no association between minimum drinking age and homicide or suicide.” But then they go on to suggest “significant” findings for just women, even though their findings show that for suicide, a woman is only 12% more likely to commit suicide if she starts drinking legally at 18, and 15% more likely to be murdered. That hardly sounds “significant” and seems small enough that statistical error alone could account for some of the difference. But more importantly, it makes no allowance for any of the literally millions of other factors that lead to any person committing suicide or being murdered. And there’s just no causation or direct correlation linking the two outcomes. The difference in time alone could account for the statistical difference. The time when the age was 18 was different than later, when it was 21. Times change, and so accordingly would how people react to it.

And again, even though it’s only women who the “study” found were affected, they note that the “trends were not mirrored among men,” but examining all this data that “proves” a link for women, their answer to why it doesn’t increase a risk for men is this. “It’s hard to say why that happened.” Well, how scientific. When the results are what they’re looking for, they point to the data. When the data doesn’t support the conclusion they want, they don’t know what happened. Hmm.

Join Together’s headline, Lower Legal Drinking Age Linked to Higher Risk for Homicide, Suicide in Women, claims there is a definite link (which the study itself never says). And their graphic shows a presumably passed out woman in front of a blurry empty bottle of liquor. At the end of their article, lead researcher Richard Grucza says the following. “In fact, what we have here is a natural experiment that supports that idea, by demonstrating an unintended but positive consequence that comes from having raised the drinking age.” But there’s nothing natural about that conclusion. Just like MADD in the past has claimed victory against drunk driving deaths while ignoring improved car safety, mandatory seat belt laws and countless other factors, this “study” looks at two cohorts of numbers and jumps to a conclusion worthy of Evel Knievel’s rocket car leap over the Snake River without ever showing a connection actually linking the two outcomes. Really, they just assume there is a connection, presumably for no better reason than they’re looking for one.

It just feels like there’s no real evidence to truly support such far-reaching conclusions, more like they’re using the data to force an outcome. They’ve certainly over-simplified society and the complex ways in which people determine they want out or want to take someone else out. So they blame alcohol, and when people started drinking.

Filed Under: Editorial, News, Politics & Law Tagged With: Cranks, Prohibitionists, Science, Statistics

Societal Costs vs. Personal Costs For Alcohol

November 3, 2011 By Jay Brooks

cdc
At first glance I thought my pals at Alcohol Justice (AJ) got their hooks in the Center for Disease Control and Prevention (CDC), because I don’t know anyone better at making up behaviors that cry out for personal responsibility that are ascribed to society (for the cost) and business (for the fault). Their absurd “charge for harm” campaign, which seeks to make alcohol companies, the businesses that sell their products, and the communities that they live in wholly responsible for the personal decisions and behavior of a minority of people who abuse alcohol, seems to have been swallowed whole in a new study, apparently by the CDC, that was recently published in the American Journal for Preventative Medicine. That study, not surprisingly, was the subject of a recent AJ press release, CDC Releases New Cost Study: Excessive Alcohol Use Cost the U.S. $223.5 Billion in 2006, which they summarize:

Of the total costs, 72.2% ($161 billion dollars) is attributed to lost productivity in the workforce. The remaining costs are attributed to healthcare (11%), criminal justice (9.4%), and effects such as property damage (7.5%). While the CDC has had strong data on premature deaths caused by alcohol consumption (79,000 annually, with an estimated 2.3 million years of potential life lost each year), it last performed an economic cost analysis in 1998, when the annual cost was estimated to be $184.6 billion.

While $223.5 billion dollars is a massive number — almost 3 times what the federal government spent on pre-primary through secondary education in 2010 — the authors of the study believe that it is a substantial understatement of the true costs of alcohol use in the United States. They recommend “effective interventions to reduce excessive alcohol consumption—including increasing alcohol excise taxes, limiting alcohol outlet density, maintaining and enforcing the minimum legal drinking age of 21 years, screening and counseling for alcohol misuse, and specific countermeasures for alcohol- impaired driving such as sobriety checkpoints.” With the national cost of alcohol consumption ringing in at nearly $2 per drink, we could not agree more.

Of course they couldn’t agree more, it’s catnip to their agenda and I wouldn’t be surprised to find a closer link to the study that has not been disclosed since it seems so much like a self-fulfilling prophecy of their own propaganda with conclusions that so closely mirror their own proposals to “fix” alcohol abuse at the expense of the majority of responsible drinkers and local craft brewers who positively affect their local economies and communities. And my instinct turns out to be true, though not with AJ, but because this study “was supported by generous grants from the Robert Wood Johnson Foundation to the CDC Foundation.” For me, that’s the smoking gun. If you don’t know who the Robert Wood Johnson Foundation is, they’re the mother of all neo-prohibitionist groups, and they fund most of the other ones, setting the agenda for a majority of other anti-alcohol organizations nationwide. Supposedly, AJ no longer accepts donations from the Robert Wood Johnson Foundation, though when I asked when they stopped receiving support from them, I never got an answer.

But a closer look at the study reveals that the charges it ascribes to “society” are not actually borne by society at large, at least to my way of thinking, but instead are paid privately by the individuals who supposedly abused alcohol or the private companies that employ them. To me, that makes them false statistics because they say one thing that turns out to not actually be true. So let’s look as those numbers of societal “costs.” Here’s the breakdowns, according to AJ’s press release:

  1. 72.2%: Lost productivity in the workforce
  2. 11%: Healthcare
  3. 9.4%: Criminal justice
  4. 7.5%: Property damage

Okay, the biggest expense blamed on alcohol abuse is “lost productivity in the workforce,” accounting for nearly three-quarters of the total, or about $161 billion. But unless they work for the government (and there’s no data on what percentage might) the costs, it seems to me, would be paid by the private companies they work for. And if they continually show up late, hungover or so they can’t do their job, how many would remain employed for an extended period of time? However you slice it, that’s not me or society paying for the poor performance of that binge-drinking employee. I suppose you could argue that a company filled with such people might result in higher prices passed along to consumers, but any such company that doesn’t weed out employees who don’t perform their jobs well is most likely going to go out of business for other reasons, as well.

The other lost productivity category is early mortality by alcohol-abusers. These people apparently selfishly die before they can do enough work to be considered to have paid their debt to be a member of society. But if you drink yourself into an early grave, your unfinished work or debt to society has got to be the least of your troubles. It’s more likely that the reasons for your early demise have multiple causes, many of which were probably not addressed by the society who was as responsible for you as they claim you were to country, state, community and family. I honestly can’t see how you can total dollar amounts for work undone by one individual, when undoubtedly another person stepped in and did it instead. I don’t mean to sound cold, but with unemployment so high, when a position becomes available under such circumstances, I feel confident that there will be someone to take that job and get the work done. So how does that cost society anything?

But let’s also look at the number itself, $161 billion. GDP at the end of 2006 (the same timeframe as this study) was $13.58 trillion. That makes this “cost to society” 1.19% of GDP. Not only is that a pretty small percentage though, even if true, nothing in their reasoning suggests it’s anything close to the truth.

The next highest cost is from healthcare. But again, unless the binge drinker has no health insurance and doesn’t pay his own medical bills, how is society paying? For those with insurance, their policy pays their medical bills, and whatever isn’t covered under their policy they become personally responsible for. I admit that it’s more likely that a person who abuses alcohol, and may not be able to keep down a job, might not have health insurance, but in the only civilized nation without universal healthcare I would argue that’s more a failure of our society than a cost to it. Whoever ends up paying for the medical care of binge drinkers, it seems more likely it will be insurance companies first, responsible individuals second, and, if at all, society last.

Third, criminal justice apparently accounts for 9.5%. What is meant by “criminal justice” includes $73 billion, of which “43.8% came from crash-related costs from driving under the influence, 17.2% came from corrections costs, and 15.1% came from lost productivity associated with homicide. Other categories include fire loss, crime victim property damage and “special education” about “fetal alcohol syndrome.” In the full text of the study, Table 2 lists who they think is responsible for all these costs, whether the government, the drinker and his family or society (though I should point out how that was arrived upon is completely absent from the study). Given that the entire study supposedly claims the “cost of excessive alcohol consumption in the United States in 2006 reached $223.5 billion,” you’d think that the personal costs even they admit to would not be a part of the total at all. Even by the CDC study’s own admission, 41% of the costs they claim are to society, are actually “paid” by the individual drinker (and his family). That’s almost half that don’t appear to be a cost to society as a whole. How does that not call into question their methodology and/or their conclusions?

But many of these other categories seem plain silly. Fire loss and property damage? Those are crimes, whether or not the person perpetrating them was drinking or not. To say it’s alcohol-related if they had a drink before they robbed someone seems as ludicrous as including a car accident in which the passenger was drinking in drunk driving statistics (which actually has been routinely done). And corrections? If you’re in jail for a crime you committed, yes that’s a cost to society, but that’s a cost we’ve all agreed is supposed to be borne by society, like the police and fire departments. It’s not like there’s some special jails that don’t count or count double if the criminal had a drinking problem. It’s really just a way to inflate the numbers and, as usual, make the problem with alcohol abuse seem far worse than it is.

And while I’m on that subject, let’s briefly mention how absurd the very definition of a “binge drinker” is in compiling these statistics, too. I’ve written about this many times, such as in Inflating Binge Drinking Statistics, Son of Binge Drinking Statistics Inconsistencies and Inventing Binge Drinking.

Lastly, “property damage,” which is really “other effects,” is listed as 7.5% of the harm blamed on alcohol. This is very confusing, because in the study’s Table 1, “criminal justice” is actually listed under “other effects” so I’m not sure what AJ is up to with their list. So I’ve actually addressed property damage above here, though Table 1 also includes a separate column for “crime-related” so the row for “criminal justice” is 100% “crime-related” so I’m not sure what’s being doubled-up on, but surely something is odd, if not intentionally.

The other factors not accounted for, as usual, are any positive effects of alcohol. Although both the study and AJ makes a big deal about what negative effects they couldn’t quantify, they’re completely unconcerned about any omitted positive ones. Certainly there are economic benefits for local communities as well as society at large. But even ignoring those, this “study” undoubtedly does not take into account how total mortality is improved by moderate, responsible drinking as set forth in the most recent FDA dietary guidelines, as well as a number of scientific studies and meta-studies that have shown the same thing. How many people who do drink moderately as part of a healthy lifestyle actually save society money because of their responsible behavior, which includes a drink or two daily?

It also doesn’t take into account how many crimes are prevented or stress relieved which might otherwise have led to “costs to society” because a person had a drink or two and calmed down, relaxed and decided not to do something rash, stupid or illegal. Given that the majority of people who drink alcohol do so responsibly and do not cost society anything, even by these absurd standards, it seems likely a lot more “costs” are actually prevented by moderate alcohol consumption. So where’s the balance? As even this “study” admits, “[m]ost of the costs were due to binge drinking — it’s the subtitle of the CDC’s press release — although the CDC claims “[e]xcessive alcohol consumption, or heavy drinking, is defined as consuming an average of more than one alcoholic beverage per day for women, and an average of more than two alcoholic beverages per day for men, and any drinking by pregnant women or underage youth.”

Of course, that’s at odds with the most recent dietary guidelines that the FDA released, which “defines ‘low-risk’ drinking as no more than 14 drinks a week for men and 7 drinks a week for women with no more than 4 drinks on any given day for men and 3 drinks a day for women.” But the anti-alcohol groups didn’t like that definition, and they gave the money for this study to be done, so they can safely ignore anything that doesn’t fit the conclusion they paid for. Why the government is so hot to be in bed with anti-alcohol factions is a bit trickier, but I feel confident money and control are at the root. The CDC’s handling of autism research has made me more than a little suspect of their motives and their ties to the medical industry and academic institutions.

But the larger picture is the question of Societal Costs vs. Personal Costs for alcohol. Few other products sold in America are as demonized as alcohol and it remains one of the few that continues to be blamed en masse for the actions of a minority of people who abuse it. Whatever harm they do personally is writ large across the entire spectrum of consumption, as if everybody who drinks is a bad person costing society its moral compass and leading us down the mother of all bad roads. We are becoming the scapegoats for all of society’s ills. Make no mistake about it, there are people who want a return to prohibition and the groundwork is being laid as we speak to try it again. And we know how well it turned out the last time. But we should be honest about it. Everything we do costs society something, but only alcohol is singled out to pay for the small number of people who abuse it. It’s a question of weighing the good with the bad and what’s best for a majority of people. Given that the vast majority of people are responsible drinkers who enjoy both drinking alcohol and the rituals that go along with it, I’d say that society has always been better off when its populace could have a beer. And that’s good both for the individual and society as a whole.

Filed Under: Breweries, Editorial, Politics & Law Tagged With: Anti-Alcohol, Government, Health & Beer, Prohibitionists, Propaganda, Statistics

We Are The 5%

October 27, 2011 By Jay Brooks

5-percent
While I support the Occupy Wall Street movement, this is something even nearer and dearer to my heart. I don’t know who came up with it, I saw it when Firestone Walker tweeted it, along with the hashtag #OccupythePub and the simple message: “Craft beer drinkers unite. We might only be 5% of the market but we are 95% of the noise!” What a great slogan and a great idea to build awareness for craft beer. We are the 5%!

we-are-five

Filed Under: Beers, Breweries, Just For Fun, Politics & Law Tagged With: Humor, Statistics

Propaganda Masquerading As A Report

October 5, 2011 By Jay Brooks

alcohol-justice
When is a report not a report? When it’s created as propaganda by an organization with the sole purpose of advancing its anti-alcohol agenda. In fact, just calling such propaganda a “report” seems dishonest in and of itself. Witness today’s press release from the self-appointed sheriff of Alcohol Alley, the newly renamed Alcohol Justice (f.k.a. the Marin Institute) entitled “Drunk With Power: Industry Kills Alcohol Mitigation Fees in California in 2010.” Talk about a loaded title. To my mind, a “report” should at least pretend to be an impartial, unbiased examination of a set of data. But as the title suggests, those of us in the alcohol industry are all “drunks,” abusing power and indiscriminately “killing.” That’s how we’re portrayed, as pure evil. Yeah, that describes me and just about everybody I know in the beer world. I hate kids and dogs, and just love pulling the wings off of flies, just for the fun of it.

The press release explains that the “report” examines the political lobbying by alcohol companies and money spent by them. Now I’m not a big fan generally of the corporate influence of our current political system, but it’s not illegal. The reason Alcohol Justice (AJ) is able to compile the lobbying money spent is because it has to be disclosed at all levels. It is, in plainer terms, legal and transparent. Nobody’s done anything wrong. They claim it “details the ever-present dominance of the alcohol industry and its lobbyists on California policymakers in 2010.” But dominance over whom? Over what? It’s not as if alcohol companies are the only people or organizations spending money on lobbying. Every company and/or industry does so. Their corporate charters all but demand that they engage in lobbying. Like it or not, it’s a part of doing business in California and the United States.

The majority of the AJ “report” includes a long list of money received by California politicians from alcohol lobbyists or as political contributions. And they’re drawing the conclusion that they therefore must have been bought off. But their “report” proves no direct correlation between receiving money and how a politician votes on legislation having to do with alcohol regulation. In fact, some of their data seems to contradict that idea.

Just looking at money received from one sector ignores any money they may also have received from any other, possibly even competing, industry or interest. And it doesn’t take into account what portion of the total money any politician received comes from alcohol and/or who else gave them contributions.

Maybe I’m jaded, but even the amounts themselves seem small, especially as a percentage of the total they received. Total lobbying expenditure by all alcohol companies is $1.3 million, according to AJ. One figure I found said that there was $552.6 million spent on lobbying in California in 2008. So that means the alcohol portion, even if they spent that much three years ago, is only 0.23% of all lobbying dollars spent. Hardly the “drunk with power” that AJ churlishly decries. That hardly demonstrates a “dominance of the alcohol industry and its lobbyists,” as they characterize it. More like a drop in the pint glass that is California politics.

The executive summary of the “report” claims that alcohol companies spent $5 million on both lobbying, campaign contributions and other political spending in 2010. Given how big our economy is, that also seems like a vanishingly small amount, especially when it is claimed that it bought so much. According to Follow the Money, California campaign contributions totaled $716,750,583 for 2010. AJ claims that of that $5 million figure, $1,572,939 was spent on candidate contributions. That means that a mere 0.22% of campaign contributions come from alcohol companies. Again, that hardly indicates the undue influences that AJ claims in their “report.”

To me, it’s just as likely that many, if not most, of the politicians don’t view the alcohol companies as pure evil, the way Alcohol Justice does. They probably see them as job creators, having a positive impact on a depressed economy and providing some enjoyment to their customers, quite necessary when so many people are out of work and their spirits so low. Not everybody who drinks abuses it, in fact most people don’t.

The politicians are most likely just people like you and me who like a drink once in a while. They’re part of the majority of people who drink moderately and responsibly, and therefore they can see the legislation for what it is: the work of fanatics who see compromise as a weakness, view all alcohol as bad, believe moderation is not the answer, and for whom only total prohibition is the only result that will satisfy them. And so they vote against it, like they should; like any reasonable person would. The majority of their constituents don’t agree with the radical ideas of neo-prohibitionists. Like most reasonable people, these politicians and the people they represent, don’t see alcohol as inherently bad; the only negative is the abuse of it by a small minority that is rarely addressed by legislation claiming to be for that purpose.

The “mitigation fees” they claim were killed by lobbying are not even a true metric. The idea that the companies that make and sell alcohol should have to pay for the damage caused by its abuse by a minority of individuals is not exactly a time worn idea. NRA lobbyists are not working to insure that gun makers don’t have to pay to mitigate the “harm” done by people shooting one another with their guns. Likewise, the red meat industry isn’t working to insure that cattle ranchers and meat packing plant owners don’t have to pay to mitigate the “harm” done by people who eat too much steak and hamburgers. Those are, quite properly, matters of personal responsibility. But according to the AJ, there is no personal responsibility for the actions of people who abuse alcohol. In that case, it’s always the fault of the people who make and sell it.

The “report” also claims that “only $10,000 was reported being spent by the industry in San Francisco to defeat Supervisor John Avalos’ Charge for Harm fee” (emphasis added), which made me laugh. Avalos may have introduced it, but it was really a Marin Institute (now AJ) initiative from start to finish. But they mention that because they think more money was spent, and wasn’t disclosed. Talk about being a sore loser.

The report also singles out a couple of politicians for their association with the alcohol industry. For example, they detail how former San Francisco mayor Gavin Newsom is, in their words, “firmly entrenched in the alcohol industry.” And that is offered as the only proof that he is somehow beholden to the interests of alcohol companies. It’s incredibly insulting to suggest that someone in politics is incapable of being impartial if they also derive some of their income from the alcohol trade. It could simply be, as Newsom himself suggested, that he saw through the “charge for harm” fiasco and viewed it for what is was — a bad idea that unfairly punished the majority of law-abiding responsible citizens — as so many others did.

The “report” begins, and ends, with the conclusion that “[t]he alcohol industry continued its ever-present dominance at all levels of California politics in 2010.” But the numbers they cite in their self-fulfilling “report” are meaningless in the vacuum of their reasoning without placing them in the larger context of the much more complicated state of politics in California. $5 million sounds like a lot of money until you actually think about how little that is compared to everything else that the state is facing. The alcohol industry in California isn’t drunk with power in California. Hell, it isn’t even tipsy.

In the same year that the alcohol industry spent $3,683,148 (the AJ’s $5 million figure minus lobbying), California agriculture spent $9,658,149, the computer industry spent $30,749,507, the energy industry spent $72,667,630, finance, insurance and real estate interests spent $64,002,966, the health care industry spent $18,759,752 and labor unions spent $76,563,954. Those industries spent 2.6, 8, 20, 17, 5 and 21 times the alcohol industry, respectively. Geez, just general business interests (not part of a specific industry) spent $29,912,733, over 8 times what the alcohol industry spent. Maybe it’s not the alcohol industry after all that’s drunk with power.

Filed Under: Editorial, Politics & Law Tagged With: Prohibitionists, Statistics

Beer Week Explosion

October 3, 2011 By Jay Brooks

week
Out at GABF last week, I heard about a few beer weeks that were new to me. As I’ve been tracking them for some time now, that surprised me. When I first put together a list a couple of years ago, there were a couple dozen. By the time I wrote the entry for beer weeks in the Oxford Companion to Beer, there were around forty. Before I left for GABF, my list included around 55. After hearing about those new ones, I decided to do some more digging and my list now includes 78 beer weeks around the world. Of those, six seem to have been held once or aren’t continuing and three more are “unofficial,” but have all the elements of a beer week (CBC Week, OBF Week and GABF Week). That still leaves 69 ongoing beer weeks, plus I also found eight more that have been announced, have Twitter feeds or Facebook pages but have not set a precise date yet. So that takes the total back up to 77 beer weeks. Of those 77, 68 are in the U.S. and 9 are outside America; in Canada, Australia, Germany and the UK. Fold back in the 3 “unofficial” ones and we’re at 79, meaning it will take over one and a half years to go to every beer week. Now that’s a lot of beer weeks. If you want to see my list of beer weeks, click here.

beer-weeks

Filed Under: Beers, Editorial, Just For Fun Tagged With: Beer Weeks, Statistics

Great American Beer Festival 1982 vs. 2011

September 23, 2011 By Jay Brooks

gabf-2011
Joey McDaniel created a cool infographic comparing the first Great American Beer Festival in 1982 to this year’s festival. Joey was introduced to craft beer by his wife, Jen, and together they run the beer blog Wet Your Whistles, covering beer in the Bay Area, with an emphasis on the “watering holes along the San Francisco Bay Area Caltrain railway line.” It’s interesting to see how far we’ve come in the 30 years since the first GABF was held. Nice job, Joey.

GABF_infograph

Filed Under: Beers, Events, Just For Fun Tagged With: GABF, Statistics

The Economy’s Down, But Alcohol Sales Are Up

June 9, 2011 By Jay Brooks

sales-chart-up
According to a short item today in CNN Money, “[a]lcohol sales climbed with little interruption throughout the recent recession, and have continued to expand in recent months.”

Over the last, for the period ending May 31st, “[a]lcoholic beverage sales grew by nearly 10%,” according to the financial information company Sageworks. During that same period of time, “the average unemployment rate during that time exceeded 9.3%.”

Sales expanded more than 9% in 2008, the first full year of the recession, when the average unemployment rate was 5.8%. Sales slumped dramatically the following year, but were still 1% higher, as the unemployment rate shot up to about 9.3%.

In 2010, sales jumped more than 9% as unemployment grew to 9.6%.

The only other industry showing similar growth is apparently health care. Sageworks analyst Sam Zippin quipped that apart from “going to the doctor, [alcohol] is another need to have.” By which I assume he means there are only two certainties during a recession, that people will either get sick or drink. And the article concedes that the old saw about beer being recession-proof “appears to be true.”

Except that Esther Kwon, who’s identified as “an alcohol industry analyst for Standard & Poor’s, says just the opposite, stating “I wouldn’t say it’s recession proof. People will buy less and they will move to different venues, meaning moving to home instead of a bar. But people will continue to drink, regardless.” Um, maybe she’s been misquoted, but isn’t that contradictory? I’m not trying to pick a fight with Kwon, but I just don’t quite understand her point. I agree with her statement that “people will continue to drink, regardless,” and that to save money, many will choose to drink it at home. But concluding from that information that alcohol isn’t recession-proof doesn’t seem to logically follow or make any sense to me.

Where they buy their alcohol, or where they drink it, has no bearing on how much people buy, apart from the price they pay. And if it’s cheaper to drink at home, that would mean they could actually buy more, doesn’t it? And if the sales growth of all alcohol companies is up nearly 10% that would likewise suggest that people are not just continuing to drink, but are drinking more. It’s a simple ipso facto, isn’t it? There’s a recession. People are drinking (or at least buying) more. Ipso facto. What am I missing that would cause a so-called “beverage analyst” to conclude otherwise?

That confusion aside, this is more good news for the craft beer industry, as within the beer industry, that’s the segment that’s showing the most growth by a very wide margin. In fact, it’s practically the only segment showing strong growth.

Filed Under: Breweries, News Tagged With: Business, Mainstream Coverage, Statistics

Beer Production Infographic

May 24, 2011 By Jay Brooks

graphchart
A recent book on beer and homebrewing, entitled Beer Craft appears to include the clever use of graphics, and in particular infographics, the best of which which are able to convey a great deal of information in a economical amount of space. Written by William Bostwick and Jessi Rymill, one of their charts was chosen by Fast Company’s Co.Design as the Infographic of the Day a few days ago. The infographic shows the number of breweries in America, along with total beer production, from 1800-2010.

BeerCraft_Production-2010

At the beginning (of the timeline, at least) there were only around 200 breweries. Rum, and other spirits, were king, and the U.S. boasted 14,000 distilleries. The advent of pilsner in 1842, along with a wave of German and European immigration, helped along by the industrial revolution, saw the number of breweries steadily increase until around 1850, when all hell broke loose. At that point, the rise of breweries in America can only be described as meteoric. When the dust settled two decades later, the number of breweries peaked in 1873 at 4,131. Consolidation, and other facts, cut the number in half by 1900 and another score of years later the number was zero, thanks to the anti-alcohol zealots who pushed through Prohibition in 1919.

Even once Prohibition ended thirteen years later, the brewing scene never recovered to anything approaching its glory days of the late 19th century. Both the business world and the world in general had changed considerably — especially after World War II — and anti-alcohol factions never admitted defeat, but merely changed tactics and continued to attack alcohol using different strategies that continue right through to the present day.

The low point is around 1980, when a mere 44 breweries made a staggering amount of beer, most of it tasting exactly the same. Since that time, total production of beer has risen only slightly, but more promisingly, the number of breweries has exploded with the microbrewery revolution that began in 1976 (and which had its origins in 1965 San Francisco). Today, we’re at nearly 1,800 breweries, the largest number since the turn of the last century. And according to the Brewers Association’s crack brewery detective, Erin Fay Glass, there are roughly 600 new breweries in various stages of their start-up phases. At the rate things are going, we should hit 2,000 breweries in America pretty soon, and quite possibly before the end of next year. Yea, beer!

Filed Under: Breweries, Just For Fun, Politics & Law Tagged With: Beer Books, Statistics

Americans Choose Bud As Favorite Beer In National Poll

May 5, 2011 By Jay Brooks

pulse-polls
According to a new poll taken on behalf of the Rasmussen Reports by Pulse Opinion Research, When Americans Drink Beer, They Go Domestic, or as the St. Louis Business Journal spun it, America’s Favorite Beer is Bud. (And thanks to James L. for sending me the story.)

I’m sure the poll is statistically accurate, they are professionals and this is their business, but it’s a little hard to swallow that a survey of 345 people can truthfully speak for 311 million Americans. But here’s what they claim to have learned from the answers to four questions gleaned from those 345 random adults, as reported in the St. Louis Business Journal.

Nearly seven in 10 American beer drinkers are choosing domestic beers over imported ones, while only 22 percent like imported beers more.

However, those people are more evenly divided when it comes to what kind of beer to drink: 49 percent prefer a light beer, while 46 percent prefer a regular one.

When given a choice, 25 percent said say they are most likely to drink Budweiser. Second choice is Miller (19 percent) and third place went to Sam Adams (7 percent). Coors, Heineken, Corona, Pabst and Guinness are next, in descending order, with each garnering between 3 percent and 6 percent. Another percent choose some other brand.

Miller is the top choice of 26 percent of male beer drinkers, while one-out-of-three women prefer a Bud.

Here’s how it shakes out.

  1. Budweiser (25%)
  2. Miller (19%)
  3. Samuel Adams (7%)
  4. Coors
  5. Heineken
  6. Corona
  7. Pabst
  8. Guinness
  9. Other (25%)

But most of the conclusions of this little polls seem odd, almost misleading, given the questions and the way in which they were asked. Here’s what people heard when Pulse phoned potential participants with this survey.

  1. Are you more likely to order a beer in a bar or restaurant or buy it to drink at home?
  2. Are you more likely to drink a domestic beer or an imported beer?
  3. Are you more likely to drink a light beer or a regular beer?
  4. Which brand of beer are you most likely to drink … Budweiser, Miller, Coors, Corona, Heineken, Pabst, Sam Adams or Guinness?

Question one seems fine (51% home; 38% in a bar or restaurant; I don’t know where the other 11% are doing their drinking, maybe both?), but it’s fairly straightforward.

For question two, the language used seems strange. Few people outside the industry use the term “domestic,” I would think, to describe American beer. But within it, it has a very specific meaning. It’s essentially beer made by one of the big brewers, as separate and distinct from craft beer. 69% said they prefer domestic, while 22% said imported, with another 9% holding a least a third choice. But what that really means, given the muddled definitions, is hard to tell.

Question three is simply personally obnoxious, because I utterly hate the very notion of low-calorie light beer. To me it’s an abomination, albeit a very popular one. So the fact that “49% choose a light beer, while 46% prefer a regular one,” is probably right but it’s just sad to me, not to mention a triumph of marketing.

But the last question is quite telling. By giving just eight choices in a multiple choices fashion, the survey leads the people being polled to pick one of the those beers, even if it’s not their favorite. Most people likely chose one from among the eight, as opposed to their favorite among the literally 10,000+ beers brewed or sold in America. That they didn’t even offer an “other” choice further makes this question somewhat misleading, and I can only imagine how a multiple choice question differs from a more open one. But what’s perhaps more interesting is that even trying to pigeonhole the answers to question four, 25% said they’d “choose some other brand.” So while the St. Louis newspaper spins this poll by claiming American’s “top choice is Budweiser” (and curiously omit the percentage number who chose “other”), an equal number prefer “not Budweiser,” that is some other beer not among the limited choices of the poll.

I realize that the macro brewers do continue to hold a commanding market share and in the poll does reflect that. For many years, the Top 5 selling beers in the U.S. have been the following.

  1. Bud Light
  2. Budweiser
  3. Miller Lite
  4. Coors Light
  5. Corona Extra

After that, it changes a little bit from year to year, but usually the bottom five include some combination of Heineken, Busch and Busch Light, Natural Light, Michelob Ultra Light and Miller High Life. Samuel Adams, Guinness and Yuengling usually fall somewhere in the 11-15 rankings. So the poll does reflect beer sales, which is what you’d expect. “Favorite” and “best-selling” are not exactly the same, but I’d argue that sales is how people vote for the favorites. In the real world, outside polls, people vote with their wallets.

So in a somewhat accurate poll that reflects current market share patterns, one in four respondents eschewed the eight choices given them (which wasn’t even an option) and chose a beer not on the list, which was equal to the top vote getter, Budweiser. It seems to me the headline should have been more along the lines of “Equal Number of Americans Prefer A Beer Other Than Bud As Pick Budweiser As Their Favorite.” Or even better, as suggested by James Wright, “35% of Americans prefer NOT Bud, NOT Miller and NOT Coors.” Alright, they’re both a little unwieldy, but to me that’s the biggest takeaway from this poll.

Filed Under: Beers, Editorial, News Tagged With: Big Brewers, Mainstream Coverage, Statistics

« Previous Page
Next Page »

Find Something

Northern California Breweries

Please consider purchasing my latest book, California Breweries North, available from Amazon, or ask for it at your local bookstore.

Recent Comments

  • Ernie Dewing on Historic Beer Birthday: Charles William Bergner 
  • Steve 'Pudgy' De Rose on Historic Beer Birthday: Jacob Schmidt
  • Jay Brooks on Beer Birthday: Bill Owens
  • Steve 'Pudgy' De Rose on Beer Birthday: Charles Finkel
  • Steve 'Pudgy' De Rose on Beer Birthday: Bill Owens

Recent Posts

  • Beer In Ads #5204: Oh Brother! Griesedieck Bros. Genuine Premium Bock Beer Is Here! February 15, 2026
  • Historic Beer Birthday: Emil Resch February 15, 2026
  • Historic Beer Birthday: Philip Zang February 15, 2026
  • Beer In Ads #5203: Robert Portner’s Bock Beer February 15, 2026
  • Historic Beer Birthday: August Schell February 15, 2026

BBB Archives

Feedback

Head Quarter
This site is hosted and maintained by H25Q.dev. Any questions or comments for the webmaster can be directed here.