Brookston Beer Bulletin

Jay R. Brooks on Beer

  • Home
  • About
  • Editorial
  • Birthdays
  • Art & Beer

Socialize

  • Dribbble
  • Email
  • Facebook
  • Flickr
  • GitHub
  • Instagram
  • LinkedIn
  • Pinterest
  • RSS
  • Twitter
  • YouTube

Powered by Genesis

Are Americans Turning Away From Beer?

August 6, 2013 By Jay Brooks

gallup-poll
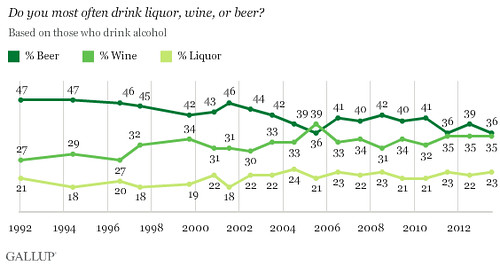
Well I can’t say that seems to be the case from my personal experience, but a new Gallup Poll is being spun that way, especially in an Atlantic article, Why Are American Drinkers Turning Against Beer? This particular Gallop Poll is done each year — since at least 1939 — and what you have to remember is that it’s a popularity poll, not necessarily a scientific one. The poll itself is conducted in a proper manner, but it’s asking people to “say what they drink” or “what they prefer.” And that’s far different from what the actual sales indicate. The last time I wrote about this was in 2010, when that year the Latest Gallup Poll Reveals Drinking At 25-Year High With Beer #1.

Gallop-2013-01

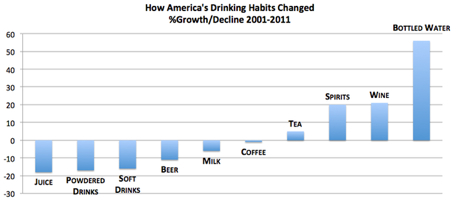
This year, the big story is “per capita consumption of beer down 20 percent,” as is overall production of beer. But as they continue to lump all beer together, when clearly patterns of drinking beer are changing, by keeping the poll simple they miss some of what’s really going on.

As my “beer brother” Lew Bryson commented. “Craft beer has been on a tear since 2002; latest figures have it up 15% annually (volume, 17% on $ sales). Volume sales of the majors are down, and trending downward steadily. Wine and spirits are picking up some of that, but craft is picking up a good share. It’s also worth noting that this IS a ‘what do you like’ poll, not ‘how much do you drink’ sales numbers. Beer still wins that by a sizable margin, both on volume and $ sales.” True indeed, when I wrote about this in 2010, beer outsold beer 4 to 1, showing just how skewed the difference is between what people say they like to drink, and what they actually drink.

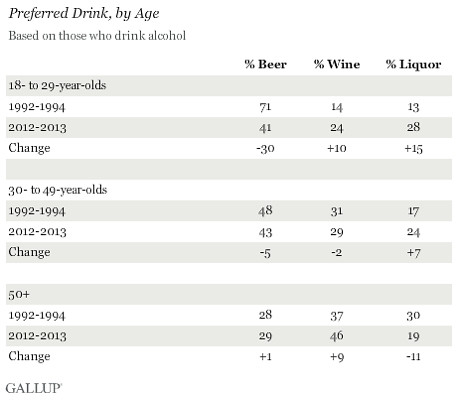
One curious thing I wonder about these polls, and other alcohol data generally, is why alcohol is always divided up into these three tidy boxes? And where in these categories, if anywhere, is captured the sales, preferences or what-have-you for cider, alcopops, sake and other beverages that don’t seem to fit neatly into one of the big three. Are they ignored, or lumped into one of the three? It’s seems a fairly relevant question, since cider’s on a big upswing and alcopops have had their ups and downs, but certainly have to be part of the equation, especially when it comes to the all-important 18-29 demographic. But not even the full report gives any additional clues.

Gallop-2013-02

Another item that makes me question Gallup’s polling is the huge gains of bottled water. To me that has more to do with availability than anything else. It’s getting harder and harder to even find a water fountain these days, because business has figured out that people will pay for it when that have no choice.

Gallop-2013-03

Another explanation that didn’t ring true was that “American drinkers are more health-conscious today” and that’s led to people choosing other beverages, but even the author admits that this “does not adequately explain why Americans would turn against light beer,” as if that really is a healthy alternative. As I’ve said endlessly, low-calorie diet beer is hardly any healthier than non-light beers so that argument doesn’t hold any water … or even any watered-down beer.

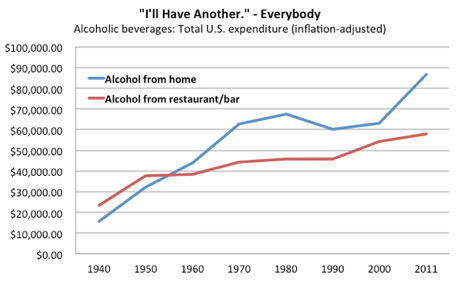
Happily, the day after this story ran on the Atlantic’s website, the same author posted The Death of Beer Has Been Greatly Exaggerated, in which Derek Thompson shows that, despite the Gallop Poll, “total U.S. spending on all alcoholic beverages — both at home and at restaurants and bars — is up 27 percent since 1980 and even more since the mid-century.”

Gallop-2013-04

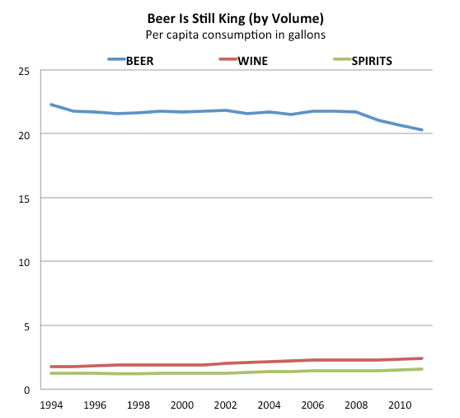
And as I mentioned earlier, beer currently still outsells wine by a significant margin, and his data also indicates that “beer volume still outsells wine volume by 8.5” times! So it’s pretty hard to swallow once more that beer is on the ropes.

Gallop-2013-05

Thompson sums up his two days worth of articles:

The total amount of beer consumed by Americans is in structural decline, and there are more wine-drinkers than there used to be. But beer is still the most popular boozy beverage in America and overall sales are holding up, thanks in part to the emergence of craft beers.

Did we really need another Gallop Poll or Atlantic business writer to tell us that?

Filed Under: Beers, Editorial, News, Politics & Law Tagged With: Mainstream Coverage, Poll, Statistics, United States

American Beer Sales Continue To Climb: BA Releases Mid-Year Numbers

August 5, 2013 By Jay Brooks

ba
You probably saw this last week, but just in case, the Brewers Association released the preliminary mid-year numbers on how beer sales are going so far in 2013. It’s probably no surprise to most that the news is good, with double-digit growth once more, a common story these days.

During the first six months of 2013, American craft beer dollar sales and volume were up 15 percent and 13 percent, respectively. Over the same period last year, dollar sales jumped 14 percent and volume increased 12 percent.

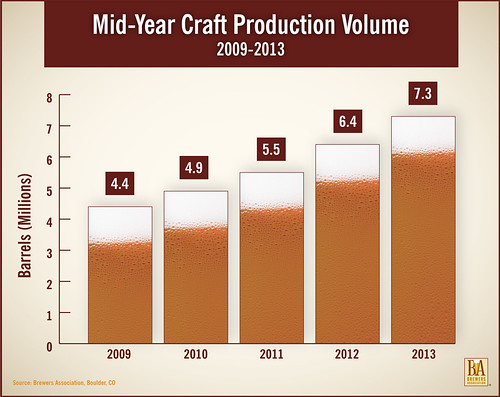
During the first half of 2013, approximately 7.3 million barrels of beer were sold by small and independent craft brewers, up from 6.4 million barrels over the first half of 2012. American craft beer continues to grow despite decreased overall beer sales, which were down two percent through the first six months of the year.

It’s nice to see the steady increases over the last five years.

MidYear_HR-2013

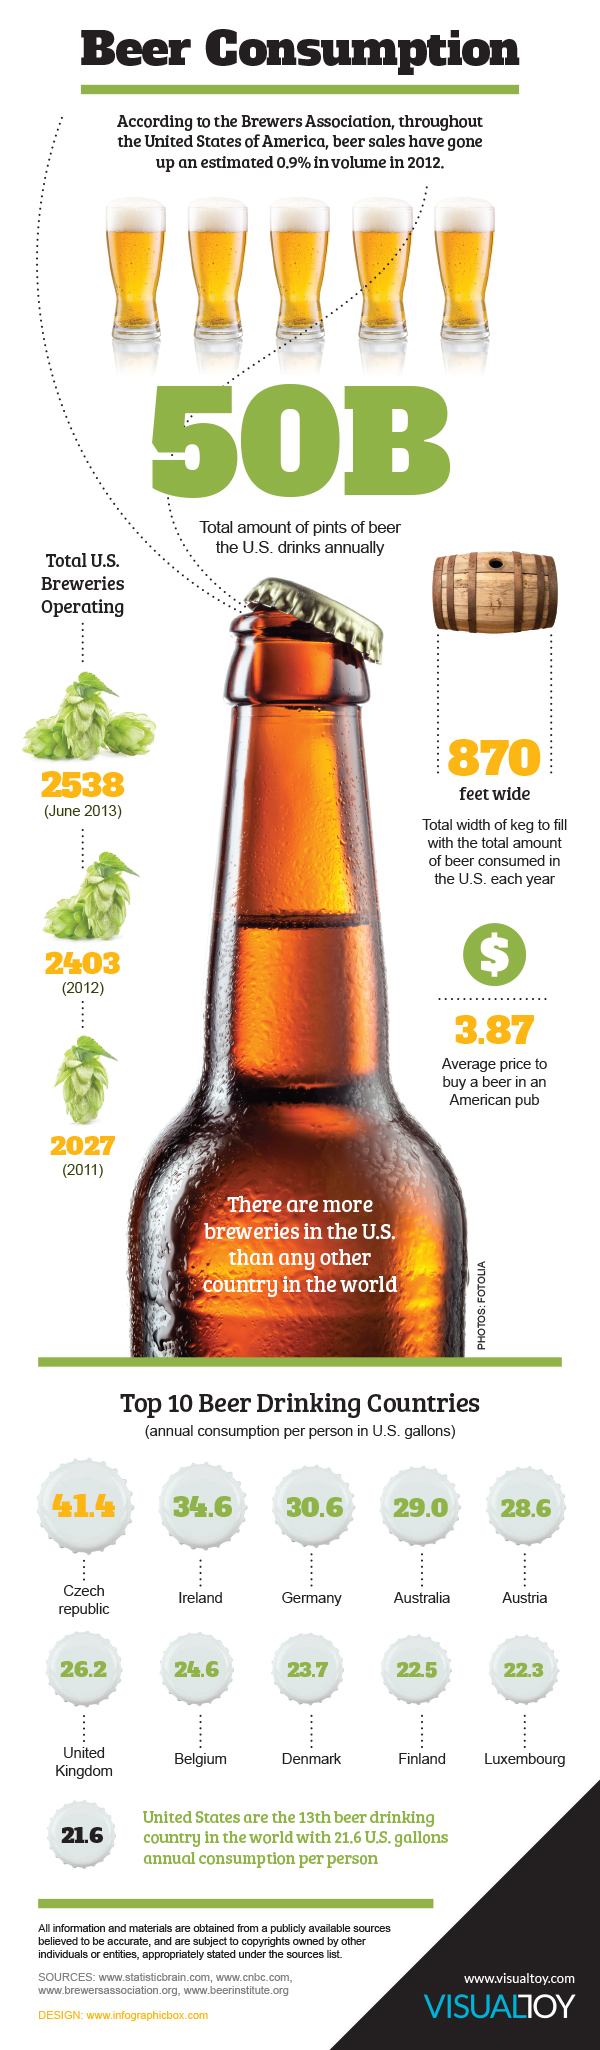
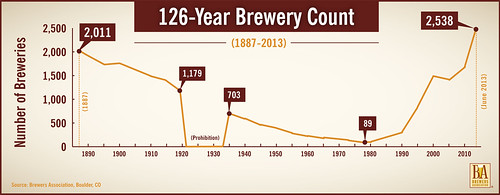
The number of breweries also continues the meteoric rise of late, with latest count standing at an amazing 2, 538.

There are 2,538 breweries operating in the U.S. as of June 30, 2013, an increase of 446 breweries since June 2012. The BA also lists an additional 1,605 breweries in planning at the year’s midpoint, compared to 1,252 a year ago. As of June 30, 2013, the count of craft breweries was at 2,483, showing that 98 percent of U.S. brewers are craft brewers. Craft brewers currently employ an estimated 108,440 full-time and part-time workers, many of which are manufacturing jobs, contributing significantly to the U.S. economy.

Brewery-Count-HR-2013

“More breweries are currently operating in the U.S. than at any time since the 1870s.” [Director of the Brewers Association, Paul] Gatza added. “With each new brewery opening, American craft brewers are reinforcing the U.S.’s position as the world’s most diverse brewing nation. It’s a very good time to be an American beer lover.”

Amen to that.

Filed Under: Beers, Breweries, News Tagged With: Brewers Association, Business, Statistics, United States

State Beer Excise Tax Rates

July 16, 2013 By Jay Brooks

tax
Today’s infographic is another map of the U.S. showing the State Beer Excise Tax Rates for each of the fifty states. Using data from 2011, it was created by the Tax Foundation.

state-beer-excise-tax-rates-2011
Click here to see the map full size.

Filed Under: Beers, Just For Fun, Politics & Law Tagged With: Infographics, Taxes, United States

Beer Serves America Interactive Map

July 15, 2013 By Jay Brooks

maps-usa
Today’s infographic is an interactive map of the country created by the Beer Institute for their Beer Serves America, which used to be a separate website, but has since been folded back into the BI website. In the interactive map, holding the cursor over the pint glass in each state bring up additional data about that state, and provides a link to a pdf with much information about the economic impact of beer for each state.

bi-at-a-glance-map
Click here to see the interactive map full size … and interacting.

Filed Under: Beers, Breweries, Just For Fun Tagged With: Beer Institute, Infographics, Statistics, United States

The Beer Belly Of America, Part 3

July 12, 2013 By Jay Brooks

beer-belly
Today’s infographic is part three of three, created by Floating Sheep in 2010, using data collected in 2008. It’s from a post entitled the Beer Belly of America. The third map shows a more normalized version of yesterday’s map, showing the “relative mentions of bars in the Google Maps directory,” which was accomplished using the average number of bar mentions.

Beer-Belly-of-America-3
Click here to see the map full size.

Filed Under: Just For Fun Tagged With: Bars, Infographics, Statistics, United States

The Beer Belly Of America, Part 2

July 11, 2013 By Jay Brooks

beer-belly
Today’s infographic is part two of three, created by Floating Sheep in 2010, using data collected in 2008. It’s from a post entitled the Beer Belly of America. The second map shows the “absolute mentions of bars in Google Maps directory.” Essentially it shows the location of every bar in America, and where the concentration of them is throughout the country.

Beer-Belly-of-America-2
Click here to see the map full size.

Filed Under: Just For Fun Tagged With: Bars, Infographics, Statistics, United States

The Beer Belly Of America, Part 1

July 10, 2013 By Jay Brooks

beer-belly
Today’s infographic is part one of three, created by Floating Sheep in 2010, using data collected in 2008. It’s from a post entitled the Beer Belly of America. The first map shows geographic references to bars vs. grocery stores, and where (in red) the bars are mentioned more frequently (and then they compared census data, which corroborated their findings).

Beer-Belly-of-America-1
Click here to see the map full size.

Filed Under: Just For Fun Tagged With: Infographics, Statistics, United States

The Geography Of Bars

July 6, 2013 By Jay Brooks

pub-sign
Today’s infographic comes from an Atlantic article on The Geography of Bars and Restaurants. The map uses data from the 2012 census and county business patterns. According to their data, New Orleans has the most bars per households, and San Francisco ranked 8th, with 6 bars for every 10,000 people. It’s also hard to see because the map is relatively small, but there’s a high-density bar area in Northern California in what I believe is Mendocino County.

And while I was mostly interested in the bars, the restaurant data is quite interesting, as well. San Francisco ranked #1 for restaurants per household, with 39.3 per 10,000 residents. That’s roughly one restaurant for every 255 persons.

Trulia_Bar_Density
Click here to see the map full size (and sorry that’s as big as it gets).

Filed Under: Beers, Just For Fun, Related Pleasures Tagged With: Bars, Infographics, Pubs, Statistics, United States

A Beer Tour Of America

July 5, 2013 By Jay Brooks

maps-usa
Today’s infographic is entitled A Beer Tour Of America, showing their choices for the top ten brewery tours you should take. It was created by Travel Insurance, which describes itself as a “comprehensive online resource for travelers and people looking for more information on travel insurance.”

beer-tour-america
Click here to see the infographic full size.

Filed Under: Breweries, Just For Fun Tagged With: Infographics, United States

Presidential Drinks Of Choice

July 4, 2013 By Jay Brooks

usa
Today’s infographic, in honor of Independence Day, is entitled Presidential Drugs of Choice, showing each out U.S. Presidents favorite alcohol, tobacco or other pleasures. It was originally part of a Kickstarter campaign by Turncoat Wine. It shows each president and then lists their preferences, of which a dozen list beer as one of their favorites.

presidential-drugs
Click here to see the poster full size.

Filed Under: Beers, Just For Fun Tagged With: History, Infographics, United States

« Previous Page
Next Page »

Find Something

Northern California Breweries

Please consider purchasing my latest book, California Breweries North, available from Amazon, or ask for it at your local bookstore.

Recent Comments

  • Bob Paolino on Beer Birthday: Grant Johnston
  • Gambrinus on Historic Beer Birthday: A.J. Houghton
  • Ernie Dewing on Historic Beer Birthday: Charles William Bergner 
  • Steve 'Pudgy' De Rose on Historic Beer Birthday: Jacob Schmidt
  • Jay Brooks on Beer Birthday: Bill Owens

Recent Posts

  • Beer Birthday: Dann Paquette August 16, 2026
  • Historic Beer Birthday: Emile A.H. Seipgens August 16, 2026
  • Beer Birthday: John Pinkerton August 16, 2026
  • Historic Beer Birthday: Johan Kjeldahl August 16, 2026
  • Charles Bukowski On Drinking August 16, 2026

BBB Archives

Feedback

Head Quarter
This site is hosted and maintained by H25Q.dev. Any questions or comments for the webmaster can be directed here.