Today’s infographic is a generic look at yeast, part of the “kitchen curious infographic series” by the Doodle Cook.

Click here to see the infographic full size.

Today’s infographic is a generic look at yeast, part of the “kitchen curious infographic series” by the Doodle Cook.
Click here to see the infographic full size.

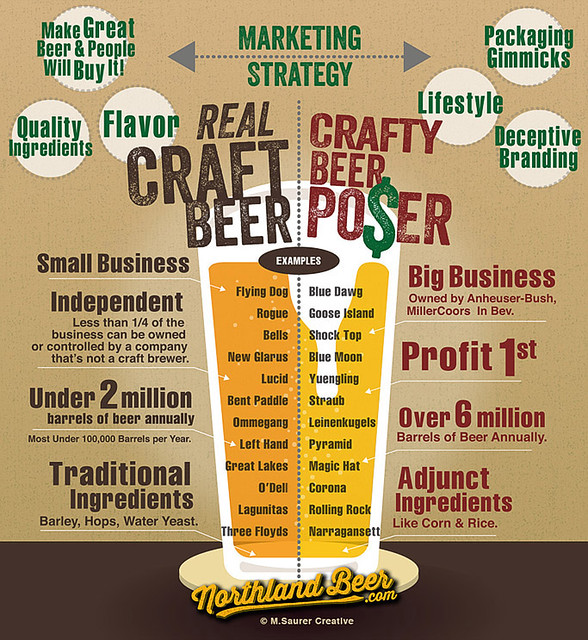
Today’s infographic tackles the recently controversial debate about Craft Beer versus Crafty Beer, beer created by the larger beer companies to resemble smaller brands. It was created by M. Saurer Creative for Northland Beer.
Click here to see the infographic full size.

Today’s infographic is entitled “Beer and Your Body,” and was created by the Micro Beer Club. It details several of the well-established health benefits of moderate beer drinking.

Click here to see the infographic full size.

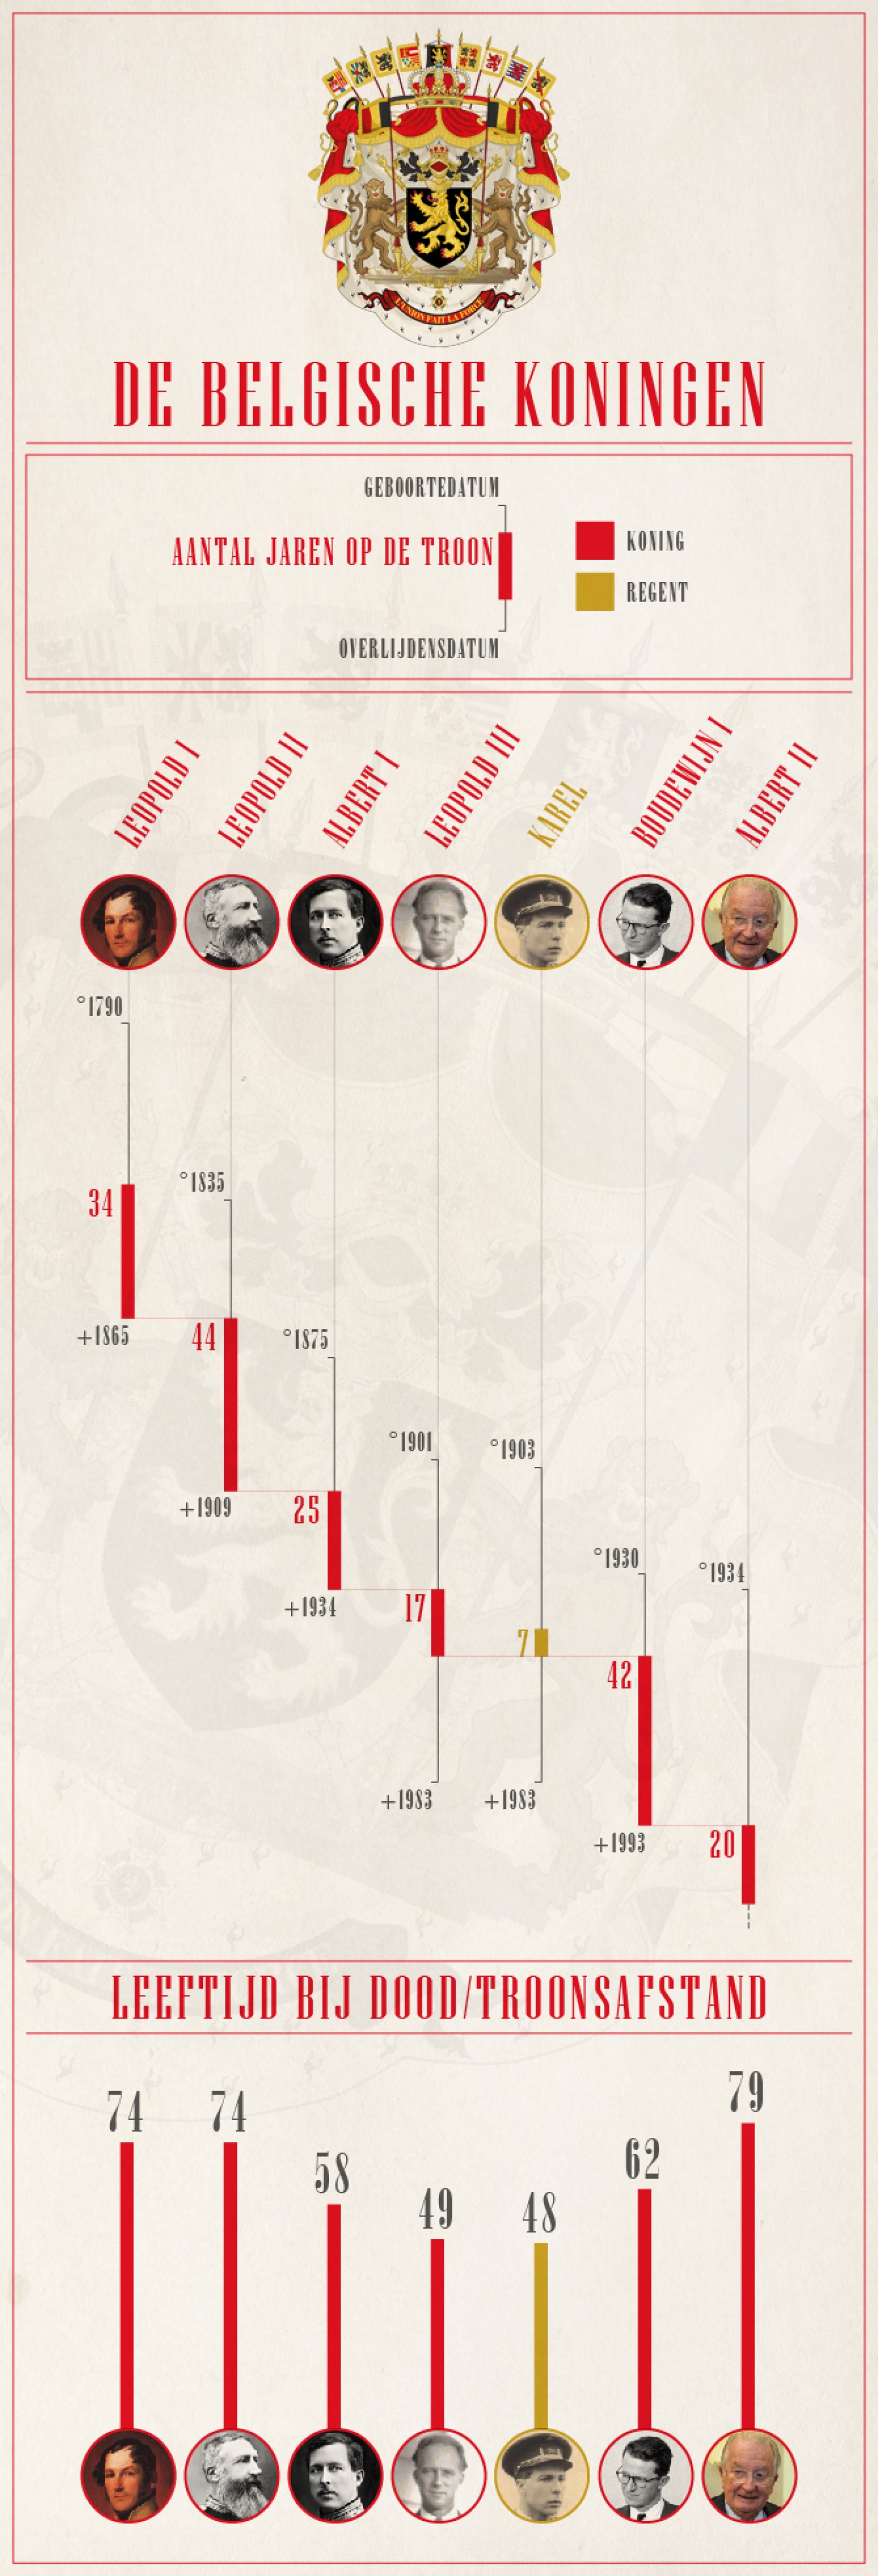
Today’s infographic, De Belgische Koningen, is a chart of Belgium’s six kings, although a seventh was crowned earlier this year. I met King Philippe this past June, when he was still just the crown prince and was leading a trade delegation to San Francisco. Plus, today is last full day in Belgium, though so far we’ve had no sign of the king.
Click here to see the chart full size.

Today’s infographic is about craft beer in cans, created by West Side Beer Distributing. The stats on the infographic were as of June of this year.

Click here to see the infographic full size.

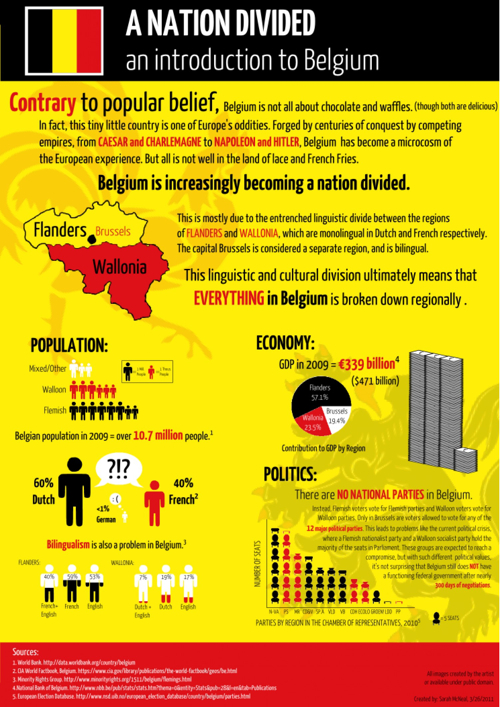
Today’s infographic isn’t strictly about beer, but the politics of Belgium. But I thought it was relevant because I’m in Belgium this week, visiting breweries throughout the Northern part of the country.
Click here to see the infographic full size.

Today’s infographic, in honor of Guy Fawkes Night, is entitled Understanding Alcohol Consumption in England, and was created by Money Expert. Unfortunately, a lot of it is based on England’s recommended “Alcohol Units,” which were shown to have been created completely arbitrarily a few years ago, yet continue to be used by the government and related health organizations.

Click here to see the infographic full size.

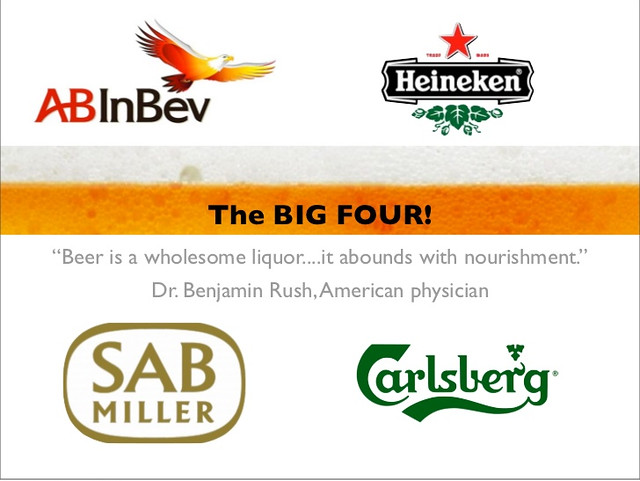
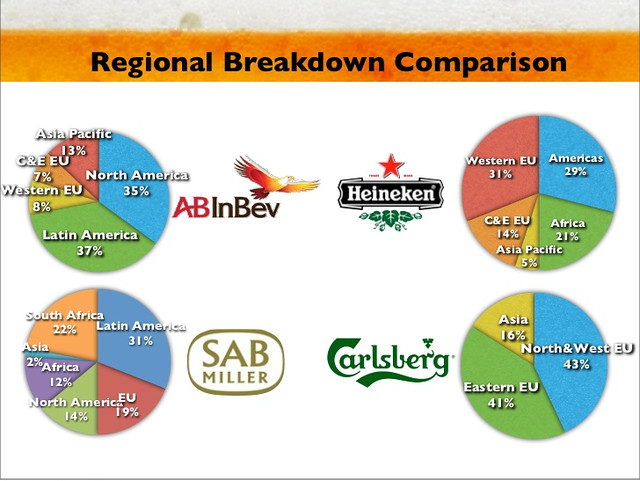
Today’s infographic is yet another pair of slides from a Powerpoint presentation on the Beer Industry by Christian Adeler and Jon Bjornstad in 2011. The first shows that worldwide, the beer industry is dominated by four global conglomerates, ABI, Heineken, SABMiller and Carlsberg.
The second slide shows the market share for each of the four companies in the major regions of the world.

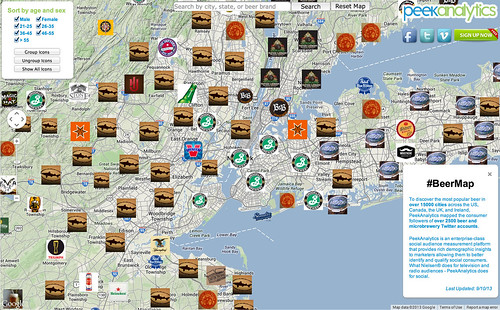
Today’s infographic is an interactive beer map of “the consumer followers of over 2500 beer and microbrewery Twitter accounts.” It was created by PeekAnalytics, who “is an enterprise-class social audience measurement platform that provides rich demographic insights to marketers allowing them to better identify and qualify social consumers. What Nielsen® does for television and radio audiences – PeekAnalytics does for social.”
The default map is the New York City area.
But you can “discover the most popular beer in over 15000 cities across the US, Canada, the UK, and Ireland” using their interactive map. Here, for example is California.
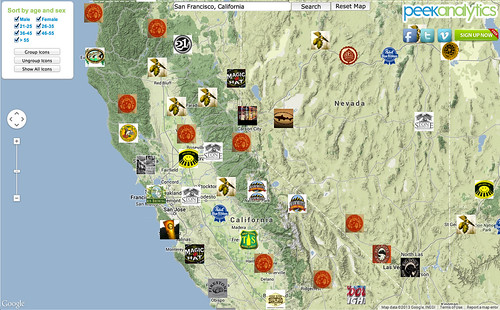
And here’s the greater Bay Area.
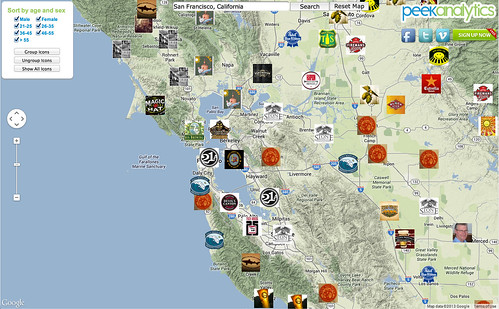
But check out your own city using PeekAnalytics Beer Map.
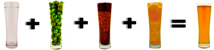
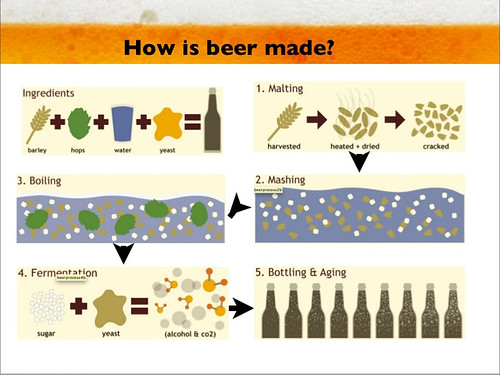
Today’s infographic is a simple illustration showing the basic steps for brewing beer. It was created for a Powerpoint presentation on the Beer Industry by Christian Adeler and Jon Bjornstad in 2011.