
Today’s infographic shows how much people are drinking around the world, along with how much brewers are making to satisfy that demand. Global Beer Production and Consumption also shows distribution of alcohol by continent.
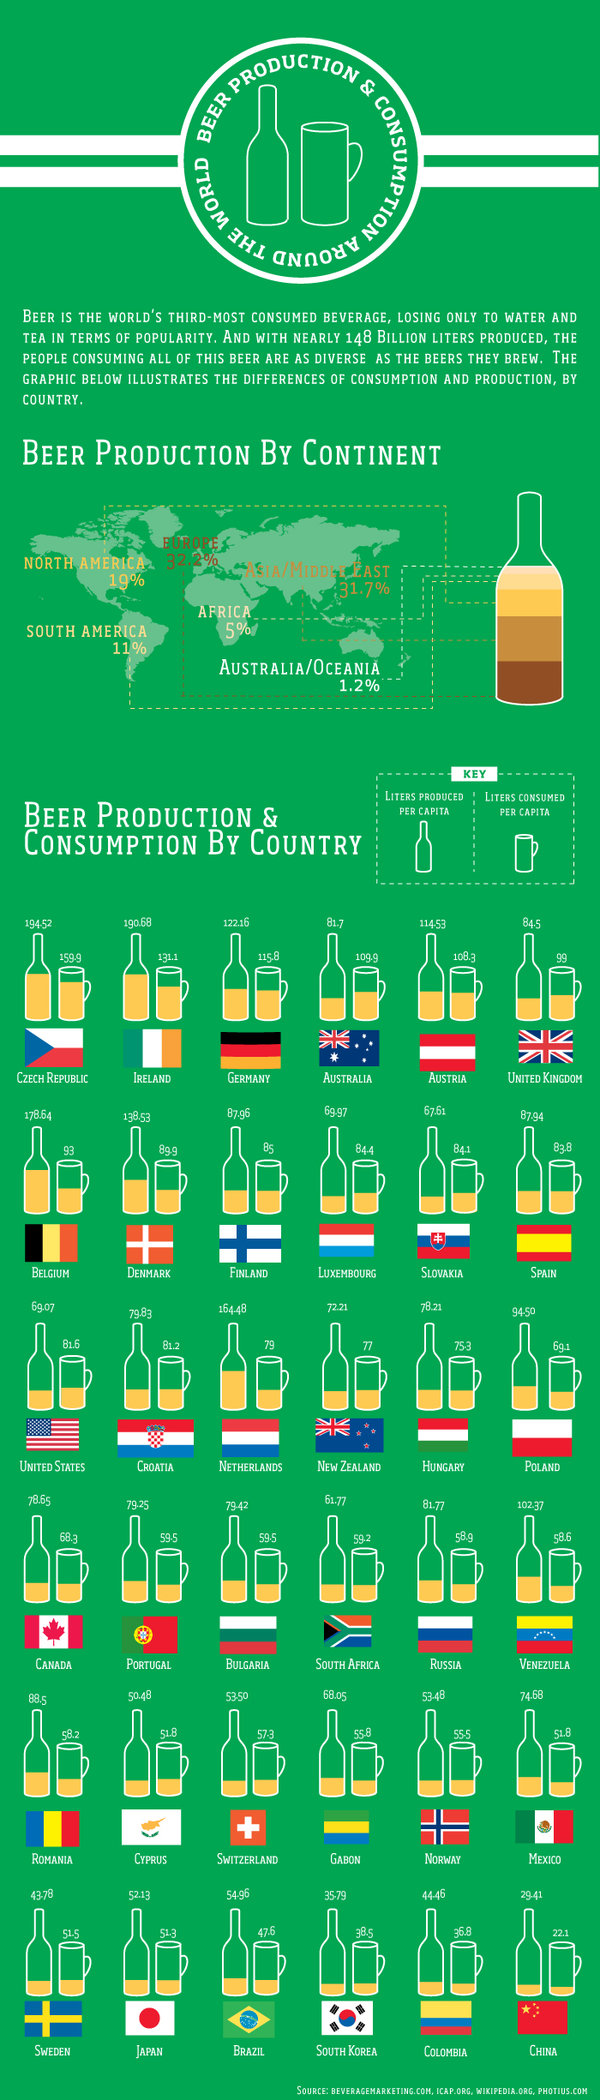

Today’s infographic shows how much people are drinking around the world, along with how much brewers are making to satisfy that demand. Global Beer Production and Consumption also shows distribution of alcohol by continent.

Todays infographic is currently being pitched on Kickstarter, and was created by Dallas, Texas graphic designer Jason Haynes. His Beer Diagram Poster has eight days to go, and so far he’s raised 21 times the amount he needs to get his poster printed. It’s available in three sizes, and you have about a week to pledge if you’d like to get one of his posters, too.

You can see it larger on the Kickstarter page.

Today’s infographic is cheekily titled Beer Me Bro. It was created by Sarah Ostman, a student at Syracuse University, while she was an intern at Lab 42. Here’s her description of the project.
We took a look at a couple different topics surrounding men and beer advertising: how men are portrayed in ads, which factors influence their beer choice, and what types of ads they find most appealing. The most surprising stat? 57% of men said they don’t relate to male characters in beer ads. Check out the infographic below for the low-down on men in beer advertising.
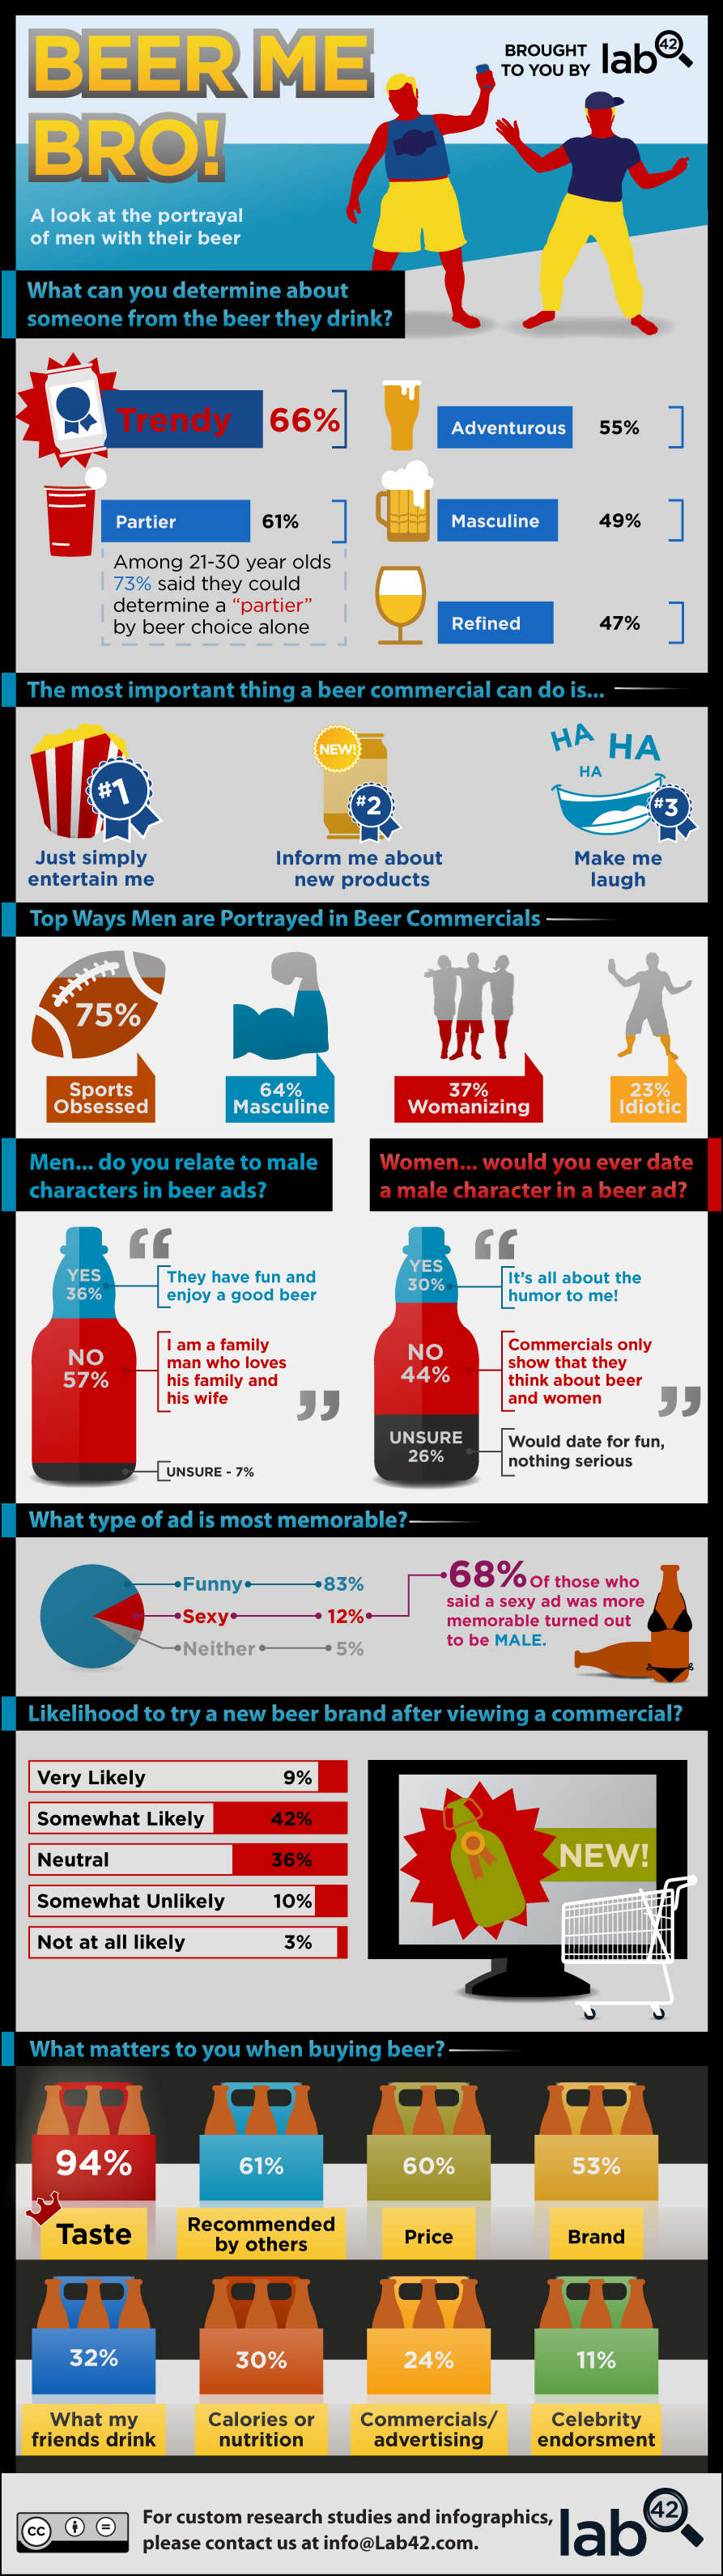
You can see the infographic full size at Lab 42.

Good for a quick chuckle. What brewers do, from different perspectives.

Click here to see it full size.

In case you didn’t see this, it’s been up since last November, but it’s pretty funny, and mesmerizing to watch, especially from the laziness of your own couch or office chair. The video is simply workers at a beer distributor in Romania sorting the cases on mixed pallets as the come into the warehouse. I”m not quite sure why it’s called “Sorting Cases of Beer Like a Boss,” I think I’d call it “Sorting Cases Like It’s Friday Afternoon Minutes Before Quitting Time.” Or maybe happy hour was about to start?

Today’s infographic is about homebrewing, or really brewing anywhere. How to Make Beer at Home appeared in the OC Weekly blog in 2011.


The Brewers Association just released the number of breweries in the U.S. as of the end of last year. As of December 31, 2012, there were 2,336, which represents an increase of 387 over the previous year, meaning just over one new brewery opened every single day. Just as staggering; the total number of breweries-in-planning stood at 1,254.
And here’s the breakdown:

Today’s infographic shows the stages of the brewing process graphically. It’s called simply The Process of Brewing Beer.

These are pretty funny. Terry Border runs a website called Bent Objects, where he creates funny dioramas using everyday objects and bent paperclips. In these two, apparently St. Pauli Girl isn’t the wholesome gal everybody thinks she is. Instead she’s terrorizing some colleagues for their nuts … beer nuts, that is.
The first is from 2008, and is titled Yeah, This is Where Those Come From.

The first one also includes these puns.
It’s also how light beers are made here in the U.S., but personally, I only like a full bodied beer.
She had often been described as a little bitter.
She was cold one, that’s for sure.
And this one’s from Valentine’s Day, 2011.

If you want to see a selection of other ones, check out Bent Objects, the Return of Bent Objects or the official Bent Objects website.

Today’s infographic showcases the World’s Strongest & Strangest Beers, at least as of last year. Who knows what stronger or stranger beers have been released since then.