Brookston Beer Bulletin

Jay R. Brooks on Beer

  • Home
  • About
  • Editorial
  • Birthdays
  • Art & Beer

Socialize

  • Dribbble
  • Email
  • Facebook
  • Flickr
  • GitHub
  • Instagram
  • LinkedIn
  • Pinterest
  • RSS
  • Twitter
  • YouTube

Powered by Genesis

The Big Four’s Regional Breakdowns Compared

November 4, 2013 By Jay Brooks

world-map
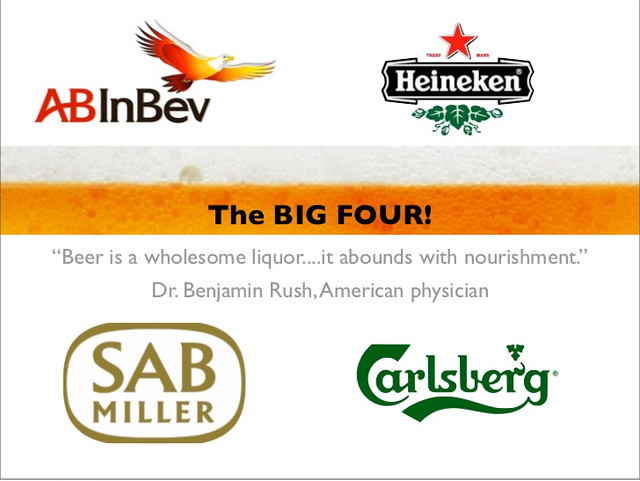
Today’s infographic is yet another pair of slides from a Powerpoint presentation on the Beer Industry by Christian Adeler and Jon Bjornstad in 2011. The first shows that worldwide, the beer industry is dominated by four global conglomerates, ABI, Heineken, SABMiller and Carlsberg.

big-4-1

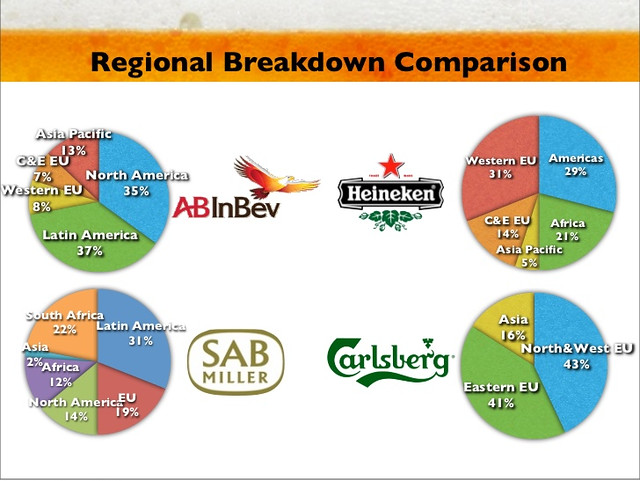
The second slide shows the market share for each of the four companies in the major regions of the world.

big-4-2

Filed Under: Breweries, Just For Fun Tagged With: Big Brewers, Business, Infographics, International, Statistics

U.S. Beer Consumption Increases; Rising Demand for Higher-Priced Offerings

October 31, 2013 By Jay Brooks

beverage-inf-group
According to a new report by the Beverage Information Group, “the beer industry saw gains in both dollar and volume in 2012 after a three-year downturn.” Their conclusion was that “well-marketed new products and slight improvements in the unemployment rate contributed to the beer industry’s overall growth.” Here’s the group’s press release with additional findings:

Super-premium, Craft, Imported and Flavored Malt Beverages out-performed the industry overall, as there is increasing demand for higher-priced beer. Super-premium and Premium increased 1.6%, and Craft increased 13.7% to reach 185.2 million 2.25-gallon cases. This is the largest increase for Craft beer in more than a decade.

Imported beer also increased for a third year, even though major brands such as Bass, Beck’s and Red Stripe were removed from the category because they are now domestically brewed. This 1% increase is largely due to consumer demand for a wider selection of products.

Innovations in the Light Beer category, such as the launch of Bud Light Platinum, were not enough to turn things around for the category. Light beer declined for the fourth year in a row. Popular and Malt Liquor also lost volume.

Although the beer industry saw positive changes in 2012, challenges still remain. According to the Beer Handbook, the beer industry will still see increases in the higher-priced categories such as Super-premium, Craft and Imported beer. It remains to be seen if these gains will help the beer industry maintain 2012’s positive direction.

“Today’s consumer no longer sees beer as their only drink option,” says Adam Rogers, senior research analyst, Beverage Information Group, Norwalk, Conn. “Spirits and wine marketers have been savvy in targeting consumers with flavored vodkas, rums and whiskies, as well as sweeter wines which have continued to take share away from the beer industry.”

For a mere $790, you can buy a copy of their annual Beer Handbook.

beverage-inf-group

Filed Under: Beers, News Tagged With: Big Brewers, Business, Press Release, Statistics

Big Slices Of The Beer Pie

October 29, 2013 By Jay Brooks

pie-chart
Today’s infographic, since there’s been so much big brewery news this week, is a clever pie chart showing the U.S. market share of the world’s largest beer companies, using bottle crowns for each piece of the pie.

big-slices-beer-pie
Click here to see the pie chart full size.

Filed Under: Breweries, Just For Fun Tagged With: Big Brewers, Infographics, Statistics, United States

Vitamins In Beer

October 27, 2013 By Jay Brooks

vitamin-b
Today’s infographic is pretty cool, showing the vitamins contained in beer. Hold your mouse’s cursor over each, and find out how many beers you’d need to drink your recommended daily requirement of that particular vitamin. It was created by Merlin U. Ward using Infogr.am.

Vitamins in Beer | Infographics

Filed Under: Beers, Just For Fun Tagged With: Health & Beer, Infographics, Statistics

The Rise Of Craft Breweries Infographic

October 26, 2013 By Jay Brooks

craft-beer-hopumentary
Today’s infographic, The Rise of Craft Breweries, was created recently, at least after this year’s GABF, by Danielle Rodabaugh for Surety Bonds Insider.

rise-of-craft-beer-infographic
CLick here to see the infographic full size.

Filed Under: Beers, Breweries, Just For Fun Tagged With: Infographics, Statistics, United States

Baseball’s Prices For An Ounce Of Beer By Stadium

October 24, 2013 By Jay Brooks

baseball
Today’s infographic shows each of Major League Baseball’s teams with their prices for beer equalized so they be compared more easily. The chart was compiled and created by Benchwarmer Sports. I don’t know if this is a coincidence or not, but yesterday the Boston Red Sox and the St. Louis Cardinals began the 2013 World Series, and their two stadiums are the most-expensive one to buy a beer. Hmm.

MLB13-price-for-an-ounce-of-beer
Click here to see the chart full size.

Filed Under: Beers, Just For Fun, Related Pleasures Tagged With: Baseball, Infographics, Sports, Statistics

Intoxication Nation Infographic

October 21, 2013 By Jay Brooks

maps-usa-bl
Today’s infographic is a second one from Blowfish, an over-the-counter hangover remedy. This one shows “how we are drinking and dealing with our hangovers,” which includes several data points about who, and what, Americans drink. The data was compiled for Blowfish by a third-party research firm.

blowfish_infographic_ext
Click here to see the map full size.

Filed Under: Beers, Breweries, Just For Fun Tagged With: Infographics, Statistics, United States

A Look at America’s Drinking Habits

October 18, 2013 By Jay Brooks

beverages
As so often happens, while searching around for something in particular, I stumble on something else interesting. Today I found an article from 2011 on AdAge entitled Bottom’s Up! A Look at America’s Drinking Habits. As of 2010 (or maybe it’s 2005), on a per capita basis, more American drink soda than any other liquid. Water is second (it’s sad it’s not first) and beer is third, with milk a close fourth. Wine is only ninth, despite those obnoxious annual polls that try to convince people wine’s more popular than beer, and spirits is tied for tenth with value-added water, whatever that means (presumably with vitamins or oxygenated?). Worldwide, water is first, while Tea, only seventh in America, is second. While certain people complain about beer drinkers here, I find it far more worrisome that more people drink soda than water. Frankly, soda is far more unhealthy to drink than beer.

hydration-nation

Filed Under: Beers, Editorial, Related Pleasures Tagged With: Statistics, United States

Beer Of Choice: State By State

October 18, 2013 By Jay Brooks

maps-usa-bl
Today’s infographic is a map of the United States, showing the beer that’s most popular in each of the states. One thing is clear, if you want to be popular, your label should be mostly blue. The map was compiled by Blowfish, an over-the-counter hangover remedy. When I look at California, I can only shake my head, slowly, and with sadness.

beer-of-choice
Click here to see the map full size.

Filed Under: Beers, Breweries, Just For Fun Tagged With: Infographics, Statistics, United States

Curious Cautions On Consumption Of Alcohol

October 16, 2013 By Jay Brooks

spirits-wine-beer
It’s not sure what to make of some news that’s being reported based on a new report by the Alcohol Research Group of Emeryville, California. Several news outlets have picked up the story, including the San Francisco Chronicle, in Sobering tip – drink makers alter alcohol content; Join Together, in Drinks Often Contain More Alcohol Than People Realize; and Health magazine, in How Much Alcohol In Your Drink? Stronger Beverages Make It Tough to Tell.

The first curiosity is some articles say the report was done by the Public Health Institute’s Alcohol Research Group while others claim it was the National Alcohol Beverage Control Association. Curiouser still is the fact that neither organization has any information I can find about the alleged report, which is odd since the news reports quote people involved in it and from it. It’s not uncommon for only a summary to be available, especially if they’re trying to sell it to people, but I can’t even find any reference to it at all. It’s also fairly common for there to be a press release summarizing the report, but I can’t locate one of those, either. The NABCA in their news section has a link to a report on their report on Health24, the same syndicated article by Brenda Goodman that many news outlets are using. You’d think they’d at least have their own story about their own report.

Although the articles concern themselves with this new report, not one of them even mentions its name, although they each quote the report’s author, William Kerr, who’s billed as “a senior scientist with the Alcohol Research Group.” Scientist seems like a stretch, since his background is not in the hard sciences, having a BA and a PhD, both in economics. Now I have nothing against economics whatsoever, in fact I love the dismal science, and am fascinated by it. I know it’s a social science, a concept I fully accept, but when’s the last time you ever heard an economist referred to as a scientist, or even a social scientist? Having the title “senior scientist” strikes me as just a tad misleading, or is that just me?

curiouser

Anyway, the point of the report, from what I can piece together, is that the standard drink sizes that are generally used determine as a single drink (mind you, for purposes of research and making people feel guilty, not for our real lives) are not as effective as they once were, because the alcoholic strength of beer and wine varies, and many people are too stupid to realize that. It honestly strikes me as a tempest in a teacup at the very least, and an attempt to fan the flames of anti-alcohol mischief at worst.

Here’s how one of the articles begins. “Thanks to rising alcohol levels in wine and beer, the drinks served in bars and restaurants are often more potent than people realize, a new report shows.” Seriously, just now rising? I know there are perhaps more higher strength beers than before the 1980s, when most beer was all the same, and certainly since craft beer is getting more popular arguably more of it’s being sold, but it’s still a drop in the ocean of the 5% beer majority. And really, is wine getting stronger? The report’s author, William Kerr, is quoted, saying “A lot of the wines now are 14 percent or even 15 percent commonly, and the standard 5-ounce glass of wine doesn’t apply to that level.” Um, as long as I can remember 14% has been the average wine strength. Seriously, if you had asked me how strong wine typically is, that would have been my immediate response. Of course, I’m no wine expert, by any stretch of the imagination, so I’ll defer to my wine brethren on that one. A Guardian article from 2011 reveals that it’s closer to 13% worldwide and 13.65% in the “New World,” by which I assume they mean us upstarts in the colonies. But if the averages are higher than what the “guidelines” are based on, wouldn’t it make more sense to argue for changing them, instead of complaining that people aren’t converting them properly? If they’re really concerned that people are drinking too much because of their own information, then changing it seems a more obvious solution to me.

Here’s another one I don’t quite understand. “Beer drinkers may find themselves in the same boat. A 12-ounce bottle of Bud Light beer has 4.2 percent alcohol, but the same-size bottle of Bud Light Platinum has 6 percent alcohol by volume, a nearly 50 percent increase.” I know math is hard, but that seems to skew the numbers to stretch a point. A 4.2% beer would contain .0504 ounces of alcohol, while at 6 percent, the amount would be 0.72. While ordinary rounding you could argue might make sense in other contexts, when you’re talking about such small numbers, the effect of rounding is inflating by one-half a percent (0.5%), not an inconsequential amount when the difference between the two examples is only 1.8%. That seems designed to make that example seem worse than it really is.

They also mention that it “matters whether you’re drinking a standard 12-ounce bottle, or downing draft beer in pints, which are 16 ounces each.” And that’s partly true, it does make a difference, but most good beer bars don’t serve higher alcohol beers in pint glasses, but in a smaller glass that’s less than that.

The Chronicle’s report claims that “craft beers and European imported beers usually have alcohol content a few percentage points higher than major American beers.” Some, sure, but their point is that beer strength varies widely, but then they give this absurd generality that’s not remotely true.

Also in the Chronicle, Kerr tells us that “Federal law requires hard alcohol manufacturers to list the alcohol content by volume on labels, but it’s optional for beer and most wines.” Actually, it’s the states that determine that, and in California it is indeed required on the label. Given that Kerr is in California, and the article was written by and for a California audience, that seems like it could have been useful information. It’s not optional here, nor do I believe that’s the case for any other state.

One thing I do agree with is the statement by Robert Pandina, director of the Rutgers Center of Alcohol Studies, who posits that the “dietary guidelines aren’t very useful. They don’t parallel the drinking habits of the American public.” So why we keep using them, I think, has more to do with people involved in the addiction business and anti-alcohol groups, then wanting to honestly come up with something that most people can actually use. Tellingly, Pandina is not part of the report that’s the subject of the articles.

The overall tone of the advice from the report, at least as gleaned from the quotes from it, is that people should be ridiculously fastidious in monitoring their intake of alcohol. But the guidelines are not that exact, nor should they be. The UK’s recommended amounts in fact were simply made up, while ours were more likely based on average drink sizes from once upon a time, and became fixed in stone along the same lines as binge drinking became increasingly narrowly defined. This, I can only guess, is the result of working with or around people with drinking problems. Most of us can manage to drink responsibly and moderately without a measuring cup or journal. If the majority of people who drink alcohol are not problem drinkers, which is the case, then being sensible doesn’t require a calculator. Most people know their limits and can, and do, moderate their own behavior and probably do so intuitively, having learned their own limits. I know mine, don’t you?

The headline that the “alcohol content of beer and wine varies widely” seems almost insulting in its assumption that most people think it’s all the same. I may not be among the average drinkers, but the news that different drinks have varying strengths seems too obvious, especially when you consider that the usual argument for not listing strength is that everyone will start shopping the labels and buy the strongest drinks to get drunk faster. So on one hand, us drinkers are smart enough to game the system by reading the labels to get drunk quicker, yet we’re too stupid to realize that different drinks have different amounts of alcohol in them. How many people honestly still believe that all beer is the same in 2013? Maybe it’s just the air of superiority that the prohibitionists and parts of the medical community adopt when they talk down to us in the world that continues to rankle. But I’ll sleep better tonight in the knowledge that by drinking moderately and responsibly, I’ll most likely live longer than the teetotalers who look down upon me and my ilk.

Alcohol

Filed Under: Editorial, News, Politics & Law Tagged With: Anti-Alcohol, Science, Statistics

« Previous Page
Next Page »

Find Something

Northern California Breweries

Please consider purchasing my latest book, California Breweries North, available from Amazon, or ask for it at your local bookstore.

Recent Comments

  • Steve 'Pudgy' De Rose on Historic Beer Birthday: Jacob Schmidt
  • Jay Brooks on Beer Birthday: Bill Owens
  • Steve 'Pudgy' De Rose on Beer Birthday: Charles Finkel
  • Steve 'Pudgy' De Rose on Beer Birthday: Bill Owens
  • Steve "Pudgy" De Rose on Beer Birthday: Pete Slosberg

Recent Posts

  • Historic Beer Birthday: Gottfried Piel December 31, 2025
  • Beer Birthday: Mitch Steele December 31, 2025
  • Beer In Ads #5156: Straub Bock Beer December 30, 2025
  • Beer Birthday: John Dean December 30, 2025
  • Beer In Ads #5155: Bock Beer Festival Parade December 29, 2025

BBB Archives

Feedback

Head Quarter
This site is hosted and maintained by H25Q.dev. Any questions or comments for the webmaster can be directed here.