

Today’s infographic, Blood Alcohol Content Effects At Different Levels, shows just that, moving from your first pint, at 0.000% BAC and proceeding to an untimely death at 0.410% BAC. It was created by Sober.com, a clearing house for treatment centers.
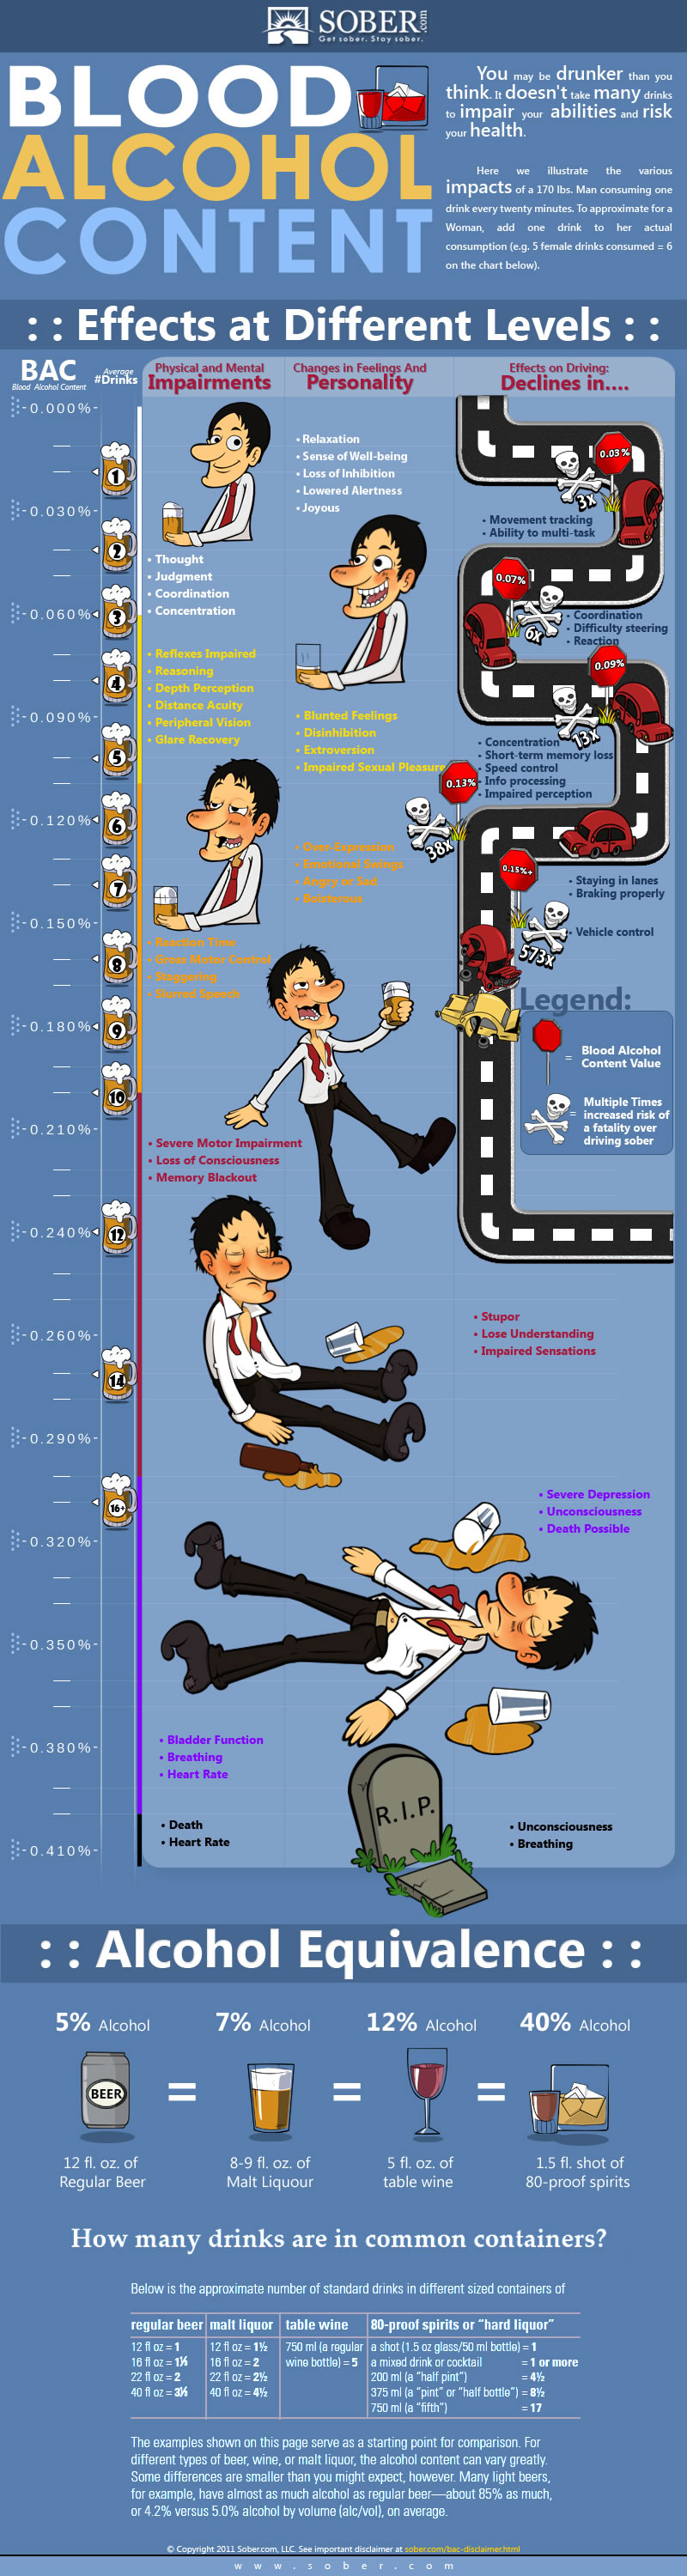
Click here to see the infographic full size.


