Brookston Beer Bulletin

Jay R. Brooks on Beer

  • Home
  • About
  • Editorial
  • Birthdays
  • Art & Beer

Socialize

  • Dribbble
  • Email
  • Facebook
  • Flickr
  • GitHub
  • Instagram
  • LinkedIn
  • Pinterest
  • RSS
  • Twitter
  • YouTube

Powered by Genesis

Top 50 Craft Breweries For 2009

April 14, 2010 By Jay Brooks

ba
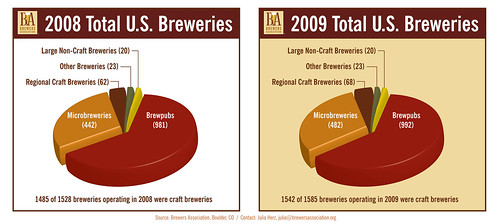
The Brewers Association just announced the top 50 breweries in the U.S. based on sales, by volume, for 2009, which is listed below here. For the third time, they’ve also released a list of the top 50 craft breweries based on the new definition adopted by the Brewers Association a few years ago. Here is the new craft brewery list:

  1. Boston Beer Co.; Boston MA
  2. Sierra Nevada Brewing; Chico CA
  3. New Belgium Brewing; Fort Collins CO
  4. Spoetzl Brewery (Gambrinus); Spoetzl TX
  5. Pyramid Breweries; Seattle WA
  6. Deschutes Brewery; Bend OR
  7. Matt Brewing; Utica NY
  8. Magic Hat Brewing Company; Burlington VT
  9. Boulevard Brewing; Kansas City MO
  10. Harpoon Brewery; Boston, MA
  11. Alaskan Brewing; Juneau AK
  12. Bell’s Brewery; Galesburg MI
  13. Kona Brewing; Kailua-Kona HI
  14. Full Sail Brewing; Hood River OR
  15. Stone Brewing; Escondido CA
  16. Dogfish Head Craft Brewery; Lewes DE
  17. Brooklyn Brewery; Brooklyn NY
  18. Abita Brewing; New Orleans LA
  19. Summit Brewing; Saint Paul MN
  20. Anchor Brewing; San Francisco CA
  21. Shipyard Brewing; Portland ME
  22. New Glarus Brewing; New Glarus WI
  23. Great Lakes Brewing; Cleveland OH
  24. Rogue Ales/Oregon Brewing; Newport OR
  25. Long Trail Brewing; Bridgewater Corners VT
  26. Lagunitas Brewing; Petaluma CA
  27. Gordon Biersch Brewing; San Jose CA
  28. Sweetwater Brewing; Atlanta GA
  29. Firestone Walker Brewing; Paso Robles CA
  30. Victory Brewing; Downingtown PA
  31. Flying Dog Brewery; Frederick MD
  32. BJs Restaurant & Brewery; Huntington Beach CA
  33. Odell Brewing; Fort Collins CO
  34. Rock Bottom Brewery Restaurants; Louisville CO
  35. Bridgeport Brewing; Portland OR
  36. Lost Coast Brewery; Eureka CA
  37. Big Sky Brewing; Missoula MT
  38. Stevens Point Brewing; Stevens Point WI
  39. Mac and Jack’s Brewery; Redmond WA
  40. Karl Strauss Breweries; San Diego CA
  41. The Saint Louis Brewery; St Louis MO
  42. Blue Point Brewing; Patchogue NY
  43. Gordon Biersch Brewery Restaurants; Chattanooga TN
  44. Oskar Blues Brewery; Longmont CO
  45. North Coast Brewing; Fort Bragg CA
  46. Breckenridge Brewery; Denver CO
  47. Utah Brewers Cooperative; Salt Lake City UT
  48. Saint Arnold Brewing; Houston TX
  49. Boulder Beer; Boulder CO
  50. Bear Republic Brewing; Cloverdale CA

Four breweries are new to the Top 50 Craft Breweries list; Bear Republic Brewing, Oskar Blues Brewery, Saint Arnold Brewing and Stevens Point. In addition, four dropped off the list; Otter Creek Brewing, Pete’s Brewing, McMenamins and Anderson Valley Brewing. Here is this year’s press release.

I’ll have my annual annotated list shortly.

Filed Under: Breweries, News Tagged With: Statistics, United States

World Beer Cup Statistics 2010

April 12, 2010 By Jay Brooks

world-beer-cup
Here’s some preliminary breakdowns of how the awards went down, who won the most by country and state. Of the 268 awards (2 medals were not awarded) from 3,351 beers by 642 breweries in 44 countries, here’s the results.

Awards by Country

  1. United States 204
  2. Germany 16
  3. TIE: 7
    • Belgium 7
    • Canada 7
  4. TIE: 5
    • Japan 5
    • UK 5
  5. TIE: 3
    • Australia 3
    • Czech Republic 3
    • Denmark 3
    • Singapore 3
  6. TIE: 2
    • Sweden 2
    • Lithuania 2
    • Italy 2

Two years ago, the U.S. was again in first with 158, followed by Germany and Belgium. This year, Canada shares third with Belgium. 19 countries won at least one medal, down from 21 two years ago.

Awards by State

  1. California 45
  2. Oregon 13
  3. TIE: 12
    • Illinois 12
    • Washington 12
  4. TIE: 11
    • Colorado 11
    • Michigan 11
  5. Virginia 8
  6. TIE: 7
    • Indiana 7
    • Missouri 7
    • Wisconsin 7
  7. TIE: 6
    • Delaware 6
    • Maryland 6
  8. Nevada 5
  9. TIE: 4
    • Arizona 4
    • Massachusetts 4
    • New Mexico 4
    • New York 4
    • North Carolina 4
    • Pennsylvania 4
  10. TIE: 3
    • Alaska 3
    • Tennessee 3
    • Utah 3
    • Wyoming 3

Last time California won 35, so we picked up 10 more awards this year. Oregon was in third place in 2008, but this time around moved into second. This year, third place was a tie between Illinois and Washington. Second in 2008 was Colorado, who dropped to a tie for fourth with Michigan.

Full winner’s list.

Filed Under: Breweries, Editorial, News Tagged With: Awards, Statistics, World Beer Cup

Mergermania & The Global Beer Picture

March 18, 2010 By Jay Brooks

piechart
Yesterday Charlie Papazian had an interesting post about recent production numbers of brewers worldwide and how the top Four brewing companies control 50% of the world’s beer. That’s due to the increasing mergermania in the brewing industry, with the recent purchase of Mexico’s FEMSA by Heineken but not including the announced acquisition of Grupo Modelo by Anheuser-Busch InBev. According to a UK Reuters report, the Top four brewers make up half [the] global beer market. The supporting data comes from a researcher for Plato Logic, a beer industry analyst company in Great Britain that produces their world beer report each October. Presumably his statistics are preliminary, taking into account changes in ownership that have taken place since the last report.

But roughly, here’s what his data shows in a chart I made, using the estimates given for millions of hectoliters produced by the top five beer companies. It shows the relatives sizes of them, and how the top four are so far out in front that it’s almost ridiculous and frankly, you can make that same argument for the top four or the top three. There’s a lot of separation, but one big merger and the deck gets shuffled again.

10-graph-1

Though the production numbers aren’t given for the bottom half of the top ten, here they are by rank.

  1. Anheuser-Busch InBev
  2. SAB Miller
  3. Heineken
  4. Carlsberg
  5. Tsingtao
  6. MolsonCoors
  7. Grupo Modelo
  8. Beijing Yanjing Brewery (China)
  9. Kirin
  10. Asahi

Estimating world beer production (it’s not given in the article) from the Beer Institute’s Brewer’s Almanac, I made the chart below to show how the top four do indeed account for just north of half the beer produced in the world.

10-graph-3

And finally, including number five Tsingtao, here’s how the overall picture looks.

10-graph-2

Filed Under: Breweries, News Tagged With: Business, International, Statistics

Craft Beer Numbers Up Again For 2009

March 8, 2010 By Jay Brooks

ba
The Brewers Association released the 2009 numbers for craft beer today, and I’m happy to report it’s good news again. While mainstream beer recently reported their largest negative sales period since the 1950s, craft beer in 2009 was up 7.2% by volume and 10.3% by dollars over the previous year. According to the press release, that represents “a growth of 613,992 barrels equal to roughly 8.5 million cases. Overall, U.S. beer sales were down approximately 5 million barrels (31 gallons per U.S. barrel) in 2009.”

From the press release:

In 2009, craft brewers represented 4.3 percent of volume and 6.9 percent of retail dollars for the total U.S. beer category. With the total U.S. beer industry representing an estimated retail dollar value of $101 billion, the Brewers Association estimates the actual dollar sales figure from craft brewers in 2009 was $7 billion, up from $6.3 billion in 2008.

The total number of U.S. craft brewers grew from 1,485 to 1,542 in 2009, and they produced 9,115,635 barrels, up from 8,501,713 barrels in 2008. Overall U.S. beer sales fell from approximately 210.4 million barrels to 205.8 million barrels.

Print

And here’s the BA’s updated fact sheet:

  • Growth of the craft brewing industry in 2009 was 7.2% by volume and 10.3% by dollars compared to growth in 2008 of 5.9% by volume and 10.1% by dollars.
  • Craft brewers sold an estimated 9,115,635 barrels of beer in 2009, up from 8,501,713 in 2008.
  • Overall, US beer sales were down 2.2% in 2009.
  • Imported beer sales were down 9.8% in 2009, equating to a loss of 2.8 million barrels.
  • The craft brewing sales share in 2009 was 4.3% by volume and 6.9% by dollars.
  • Craft brewer retail dollar value in 2009 was an estimated $6.86 billion, up from $6.32 billion in 2008.
  • 1,585 breweries operated for some or all of 2009, the highest total since before Prohibition.

Filed Under: Breweries, News Tagged With: Business, Press Release, Statistics

Anti-Alcohol Ads Driving People To Drink … More

March 2, 2010 By Jay Brooks

target-alcohol
I’ve long held the belief that anti-alcohol ads that attempt to stop people from drinking by trying to make them feel guilty are ineffective. Pointing out the harm that such people may cause to themselves or others never seemed like the right way to encourage responsible behavior. Many, if not most, people who abuse alcohol, or any other substance, usually do so for some underlying reason. Attacking the result and not the cause always seemed like the wrong approach, like blaming the gun instead of the person who pulled the trigger. It turns out my intuition may have been correct after all.

A study soon to be published in the April edition of the Journal of Marketing Research appears to confirm that. The article, Emotional Compatibility and the Effectiveness of Antidrinking Messages: A Defensive Processing Perspective on Shame and Guilt by Nidhi Agrawal and Adam Duhachek, is based on research conducted at the University of Indiana. Their research revealed that not only do such guilt-ridden ads not work, but they actually exacerbate the problem, making it worse.

According to IU researcher Duhachek:

“The public health and marketing communities expend considerable effort and capital on these campaigns but have long suspected they were less effective than hoped,” said Adam Duhachek, a marketing professor and co-author of the study. “But the situation is worse than wasted money or effort. These ads ultimately may do more harm than good because they have the potential to spur more of the behavior they’re trying to prevent.”

That’s right folks, the neo-prohibitionist groups that have been trying to guilt people into not drinking have actually been making people drink more, perhaps causing more harm than if they’d just shut up and let people live their lives.

Here’s more about the study from a recent press release from the Indiana University Newsroom:

Duhachek’s research specifically explores anti-drinking ads that link to the many possible adverse results of alcohol abuse, such as blackouts and car accidents, while eliciting feelings of shame and guilt. Findings show such messages are too difficult to process among viewers already experiencing these emotions — for example, those who already have alcohol-related transgressions.

To cope, they adopt a defensive mindset that allows them to underestimate their susceptibility to the consequences highlighted in the ads; that is, that the consequences happen only to “other people.” The result is they engage in greater amounts of irresponsible drinking, according to respondents.

“Advertisements are capable of bringing forth feelings so unpleasant that we’re compelled to eliminate them by whatever means possible,” said Duhachek. “This motivation is sufficiently strong to convince us we’re immune to certain risks.”

So essentially, the ads trigger a defense mechanism that causes people “to believe that bad things related to drinking can only happen to others and can actually increase irresponsible drinking.”

Onlybeer
An anti-alcohol group’s PSA equating beer with heroin. It was never funny, and I always found it offensive, but it turns out it may have even driven people to drink more. You can also see more of the ads the researchers used for their study at the Media Awareness Network.

Even though the study won’t be published until next month, you can read an advance pdf of it at the Advance Articles page of the Journal (it’s the sixth one from the top). The study is 32-pages long, with another 10 pages of bibliography and other supporting data.

While the study stops short of suggesting that such ads have over time made teens and other target demographics drink more, they do caution that future ads seeking to curb dangerous behaviors employing “guilt and shame appeals should be used cautiously.” Essentially, they politely suggest that the anti-alcohol community think about what they’re doing and the consequences of ad campaigns that do not include a well-planned media strategy. What I wonder is whether or not the groups responsible for such ads will feel any guilt themselves for driving people to drink more.

UPDATE: Advertising Age had another story about this study, but from the perspective of the journal article’s other author, Nidhi Agrawal, from the Northwestern University’s Kellogg School of Management.

Filed Under: Editorial, News, Politics & Law Tagged With: Advertising, Prohibitionists, Statistics

UK Craft Paralleling US Craft Market

February 22, 2010 By Jay Brooks

siba
For several years now — maybe a decade? — craft beer has been growing at a faster rate than the older, big breweries. Naturally, they’re so big that even small percentage growth adds up to big dollars while craft beer, for the most part, with a smaller base has far more room to grow. As a result, this has been happening year after year without changing the overall landscape of the American beer market very much. It is changing, but very, very slowly (or at least slower than I’d like).

Perhaps more importantly, this sustained growth in the craft segment while the mainstream market continues to slip suggests a broader trend and what the future might hold, at least eventually. It certainly has worried the big brewers to some extent as they continue to test market micro-like products, niche products, buy into existing craft brewers and other actions calculated to take back some of the market share lost to the craft segment, no matter how small. It’s nothing sinister, just the way corporations operate. Perpetual growth sets the share price, and they must answer to the shareholders when sales goals are not met.

As our economy tanked this trend continued, with growth slowing in both big and small segments of the industry. While beer narrowly upheld its status as “recession-proof,” it did slow somewhat. Big beer went negative while craft continues to grow, but at a slower rate, at least in terms of volume of sales. In dollars, growth remained strong, but mostly because of higher prices. Of course, I also think that craft beer can sustain higher margins than big beer, whose drive to increase volume has seen price wars for decades. That gives craft another advantage, I think, because reaching a sustainable, profitable business model doesn’t have to involve going public, huge growth or answering to shareholders. Anchor Brewery is an excellent example of growing big enough and then sustaining that level while remaining profitable. Anchor has no desire to grow larger, and their future is entirely positive. It’s the opposite of the corporate model, and the one employed by most craft brewers. And I think it bodes well for the future of craft beer.

Today, the Society of Independent Brewers (SIBA) released a report about the state of things in the UK beer market, and there are some interesting parallels between the two markets.

Some key findings:

  • Local brewers achieved a 3.75% increase in volume sales in 2009, while the overall beer market fell 4.2%
  • Three-quarters of all local brewers recorded volume growth in 2009
  • On average, they achieved a 17% increase in sales turnover
  • Pubs continue to close, but local cask ale volumes rise by 1.27%
  • Local bottled beer production up by 16%

The entire report is available as a pdf at the bottom of the article about it in today’s Morning Advertiser. Another interesting stat not mentioned is that 22%, the highest percentage, of independent beer is sold to the consumer directly by the brewery in their shops or via their website. Second was Supermarkets (21%) and third was through independent pubs (19%).

Filed Under: Breweries, Editorial, News Tagged With: Big Brewers, Business, Statistics, UK

Super Bowl Shut-Ins

February 4, 2010 By Jay Brooks

football
I don’t recall who originally Tweeted this, but I believe it was one of the Alströms, either Todd or Jason, so thanks to whichever one of you passed along these interesting Super Bowl statistics. The statistics I’m talking about came from the NielsenWire, the same folks that tally who watches which TV shows. While it’s believed by most people that the Super Bowl is a huge revenue generator for alcohol, especially beer, and snack foods, it would appear that’s not actually the case. In fact, the Super Bowl weekend actually ranks seventh. According to Nielsen’s research, 9 in 10 Will Watch Super Bowl at Home; Most will Spend the Same or Less on Food and Beverages. According to the data, 90% of everyone who watches the Saints and Colts vie for the Lombardi trophy this Sunday will be either at home or a friend/relative’s house. Of those, 95% are planning on buying less beer and food. That’s welcome news for grocery stores but not so good for bars, brewpubs and restaurants.

superbowl-plan
Here’s the breakdown of where people will watch the Super Bowl.

superbowl-spend
Here’s a chart of football watching spending. Sadly, crackers outsell my beloved potato chips.

Filed Under: Beers, Editorial, Events Tagged With: Football, Sports, Statistics, Super Bowl

Drinking All Over The Map

January 27, 2010 By Jay Brooks

world-map
If you’re a regular Bulletin reader, you know I believe that the drinking age in the U.S. is too high, that the age a person can vote and fight and/or die for one’s country should also be the age he or she can drink, as well. I lived through this ridiculous hypocritical double-standard when I was in the military thirty years ago, and I still hold a grudge. It was absurd then, and it’s absurd now.

I think most of us believe that America is a progressive country where freedom is something we take for granted, that it’s the lynchpin of our society with free speech, free assembly, freedom of religion, and on and on. But not when it comes to our puritanical view of alcohol, there we are nearly the most backward country in the world. When you take out the handful of countries that allow no alcohol consumption — which are all in the Middle East — only India has a drinking age higher than ours, and even that’s not nationwide, but on a state by state basis. I could talk about this ’till I’m blue in the face, but nothing shows this inequity better than a visual representation of drinking ages by country. Happily, Drinking Map went to the trouble of creating a world map showing the drinking age by country, where known. To see it larger, click through the image, then click on “all sizes.”

drinking-age-map

As you can see, the vast majority of the world is at a sensible 18, with only a few other nations (all in the Middle East, too) that are 21 like us. Japan and most of Scandinavia set the age at 20 and South Korea along with parts of Canada are at 19.

But perhaps more interesting is the map below, also by the folks at Drinking Map, called Where “Adults” Can’t Drink. This map shows the relationship between a country’s age of majority (when a person is considered an “adult”) and the age at which they are permitted to drink alcohol. Notice that for a majority of nations (in green) that age is the same, as I believe it should be. A few more (in pink), like India and most of Scandinavia, allow some drinking but with certain restrictions. Then we, along with parts of Canada and a handful of other nations (in red), stand out as having a drinking age that’s higher than the age of majority. To see it larger, click through the image, then click on “all sizes.”

age-of-majority-map

Would it not be perhaps a reasonable compromise to allow 18-year olds to drink beer, or wine and beer, but not spirits until they’re 21? Anyway, just some food for thought.

Filed Under: Editorial, Just For Fun, Politics & Law Tagged With: International, Prohibitionists, Statistics

Loud Music Increases Drinking

January 26, 2010 By Jay Brooks

volume-green
I found this interesting bit of research at the PsyBlog, run by Jeremy Dean, a Psychology researcher at the University College London. The post is entitled Why Loud Music in Bars Increases Alcohol Consumption, and concerns some recent research conducted into the relationship between volume and drinking patterns. Specifically, Dean cites two studies, one in Glasgow, Scotland and the other in France. In some ways the findings are obvious, but it does tend to confirm what you probably already guessed. The PsyBlog starts with the premise that the average bar traditionally keeps the lights dim and the music loud.

But turning the music up so loud that people are forced to shout at each other doesn’t have quite the same beneficial effect on social interactions. Because everyone is shouting, the bar becomes even noisier and soon people start to give up trying to communicate and focus on their drinking, meaning more trips to the bar, and more regrets in the morning.

Of course this is exactly what bar owners are hoping for. People sitting around quietly nursing their drinks for hours are no good for profits. Talkers aren’t the best drinkers. At least that is the received wisdom in the industry.

The first study, Sound Level of Environmental Music and Drinking Behavior: A Field Experiment With Beer Drinkers, was published in the journal Alcoholism: Clinical and Experimental Research. Their results indicated “that high level volume led to increase alcohol consumption and reduced the average amount of time spent by the patrons to drink their glass.”

The second study was published in the journal Popular Music & Society, and was titled Alco-pop? The Use of Popular Music in Glasgow Pubs.

volume-to-11
Here’s a bit more as to how the research was conducted.

The level of the music was randomly manipulated to create the conditions of a true experiment. It was either at its usual volume of 72dB or turned up to 88dB. For comparison: 72db is like the sound of traffic on a busy street while 88db is like standing next to a lawnmower.

Sure enough when the music went up the beers went down, faster. On average bar-goers took 14.5 minutes to finish a 250ml (8 oz) glass of draught beer when the music was at its normal level. But this came down to just 11.5 minutes when the music was turned up. As a result, on average, during their time in the bar each participant ordered one more drink in the loud music condition than in the normal music condition.

The observers even measured the number of gulps taken to finish each drink — the level of the music was found to have no effect on this. So the faster drinking was as a result of more gulps rather than bigger gulps.

The conclusions from both studies seem to validate one another, suggesting a universal application. The results do seem to favor a causal connection between louder music and increased drinking, but what they don’t answer is why this is the case. As Dean puts it. “Some think that people drink instead of talking while others have argued that they drink more because the music creates greater levels of arousal, which then leads to more drinking.”

Personally, I prefer a bar where I can hear myself think, where pleasant conversation is encouraged, but then I prefer to sip, not gulp, my beer in almost any environment. So clearly, I’m not the target demographic, nor I suspect are most hardcore beer geeks, but it still is a fascinating peek into what makes us tick — and drink.

UPDATE: The BC Brews Blog also came across this study independently and posted about it in Loud Music = Heavier, Faster Drinking.

Filed Under: Beers, Editorial, Just For Fun Tagged With: Pubs, Science, Statistics

More Sober Statistics

January 25, 2010 By Jay Brooks

no-drinking-pint
Yesterday, I had a post about some sober statistics that came from CDC — and specifically their Behavioral Risk Factor Surveillance System — by way of an article in U.S. News & World Report. The statistics from the article concerned the most sober American cities according to their (questionable) data.

But there were two additional data points from two other questions asked in the poll conducted by the CDC. So I thought I’d see what those questions were all about. Here are some more lists based on that data.

1. Alcohol Consumption: Adults who have had at least one drink of alcohol within the past 30 days

In this one, pollsters asked people if they’d had a drink of alcohol in the last 30 days. The list below is the cities (which the CDC classifies as “Metropolitan Statistical Areas”) which had the most people who have not touched alcohol in the month before they were polled. The number is parenthesis is the percentage who answered no.

  1. Provo-Orem, UT (88.3)
  2. Ogden-Clearfield, UT (75.3)
  3. Kingsport-Bristol, TN (72.3)
  4. Huntington-Ashland, WV-KY-OH (71.1)
  5. Idaho Falls, ID (71.0)
  6. Charleston, WV (67.9)
  7. Tuscaloosa, AL (64.6)
  8. Chattanooga, TN-GA (64.0)
  9. Okeechobee, FL (63.1)
  10. Memphis, TN (62.6)
  11. Salt Lake City, UT (62.5)
  12. Hickory-Morganton-Lenoir, NC (62.1)
  13. McAllen-Edinburg-Mission, TX (61.6)
  14. Lake Charles, LA (61.2)
  15. Louisville, KY-IN (59.6)

Not many surprises again from what you might guess, all the states are from the south plus nearby West Virginia and Utah, where Mormonism holds sway.

So here’s the opposite list, the metropolitan areas with the highest percentage of people who have had alcohol in the last month.

  1. Cambridge-Newton-Framingham, MA (69.5)
  2. Nassau-Suffolk, NY (69.4)
  3. Barnstable Town, MA (69.0)
  4. Burlington-South Burlington, VT (68.8)
  5. Boulder, CO (68.7)
  6. Barre, VT (68.7)
  7. Concord, NH (68.7)
  8. Denver-Aurora, CO (66.2)
  9. Warren-Troy-Farmington Hills, MI (65.6)
  10. Fargo, ND-MN (65.5)
  11. Essex County, MA (65.4)
  12. Hartford-West Hartford-East Hartford, CT (65.2)
  13. Portland-South Portland-Biddeford, ME (64.8)
  14. Boston-Quincy, MA (64.5)
  15. Worcester, MA (64.3)
  16. Seattle-Bellevue-Everett, WA (64.2)

stay-sober

2. Alcohol Consumption: Binge drinkers (males having five or more drinks on one occasion, females having four or more drinks on one occasion)

The second question asked people if they’d had a drinking binge (by their ridiculous definition, of course) but curiously it doesn’t say within what period of time. So without the actual question asked, we have to conclude that there was no time period (because it would almost certainly appear in the statistical data). That means this is an expression of who’d had five or more drinks at one session … ever. Hmm.

Here’s the ten metropolitan areas with the fewest binge drinkers. The number in parenthesis represents the percentage of people who have never had five or more drinks at one sitting.

  1. Provo-Orem, UT (95.7)
  2. Wauchula, FL (94.6)
  3. Charleston, WV (92.2)
  4. Chattanooga, TN-GA (92.0)
  5. Fort Smith, AR-OK (91.8)
  6. Louisville, KY-IN (91.6)
  7. Huntington-Ashland, WV-KY-OH (91.3)
  8. Idaho Falls, ID (91.3)
  9. Ogden-Clearfield, UT (91.3)
  10. Asheville, NC (91.0)

I must live in truly decadent places because I can’t even imagine a place where 9 of the 10 people you meet on the street have NEVER had five drinks at one time.

But here’s my people, the areas where the most binge drinking takes place. I should hasten to point out that I don’t believe for a second that binge drinking is a good idea, but that the CDC definition is complete and utter nonsense.

  1. Milwaukee-Waukesha-West Allis, WI (21.4)
  2. Fargo, ND-MN (21.2)
  3. Omaha-Council Bluffs, NE-IA (21.2)
  4. Austin-Round Rock, TX (20.6)
  5. Burlington-South Burlington, VT (20.5)
  6. Chicago-Naperville-Joliet, IL-IN (20.4)
  7. Boulder, CO (20.3)
  8. Key West-Marathon, FL (20.3)
  9. Gainesville, FL (20.2)
  10. Greeley, CO (20.1)

The numbers themselves still seem a bit low. The percentages are for people who said yes, they’ve had five drinks at one sitting. Even the highest percentage are would be roughly 1 in 5. But it may simply be a factor of people under-reporting what they perceive to be bad behavior.

Filed Under: Editorial, Just For Fun Tagged With: Statistics

« Previous Page
Next Page »

Find Something

Northern California Breweries

Please consider purchasing my latest book, California Breweries North, available from Amazon, or ask for it at your local bookstore.

Recent Comments

  • Ernie Dewing on Historic Beer Birthday: Charles William Bergner 
  • Steve 'Pudgy' De Rose on Historic Beer Birthday: Jacob Schmidt
  • Jay Brooks on Beer Birthday: Bill Owens
  • Steve 'Pudgy' De Rose on Beer Birthday: Charles Finkel
  • Steve 'Pudgy' De Rose on Beer Birthday: Bill Owens

Recent Posts

  • Beer In Ads #5204: Oh Brother! Griesedieck Bros. Genuine Premium Bock Beer Is Here! February 15, 2026
  • Historic Beer Birthday: Emil Resch February 15, 2026
  • Historic Beer Birthday: Philip Zang February 15, 2026
  • Beer In Ads #5203: Robert Portner’s Bock Beer February 15, 2026
  • Historic Beer Birthday: August Schell February 15, 2026

BBB Archives

Feedback

Head Quarter
This site is hosted and maintained by H25Q.dev. Any questions or comments for the webmaster can be directed here.