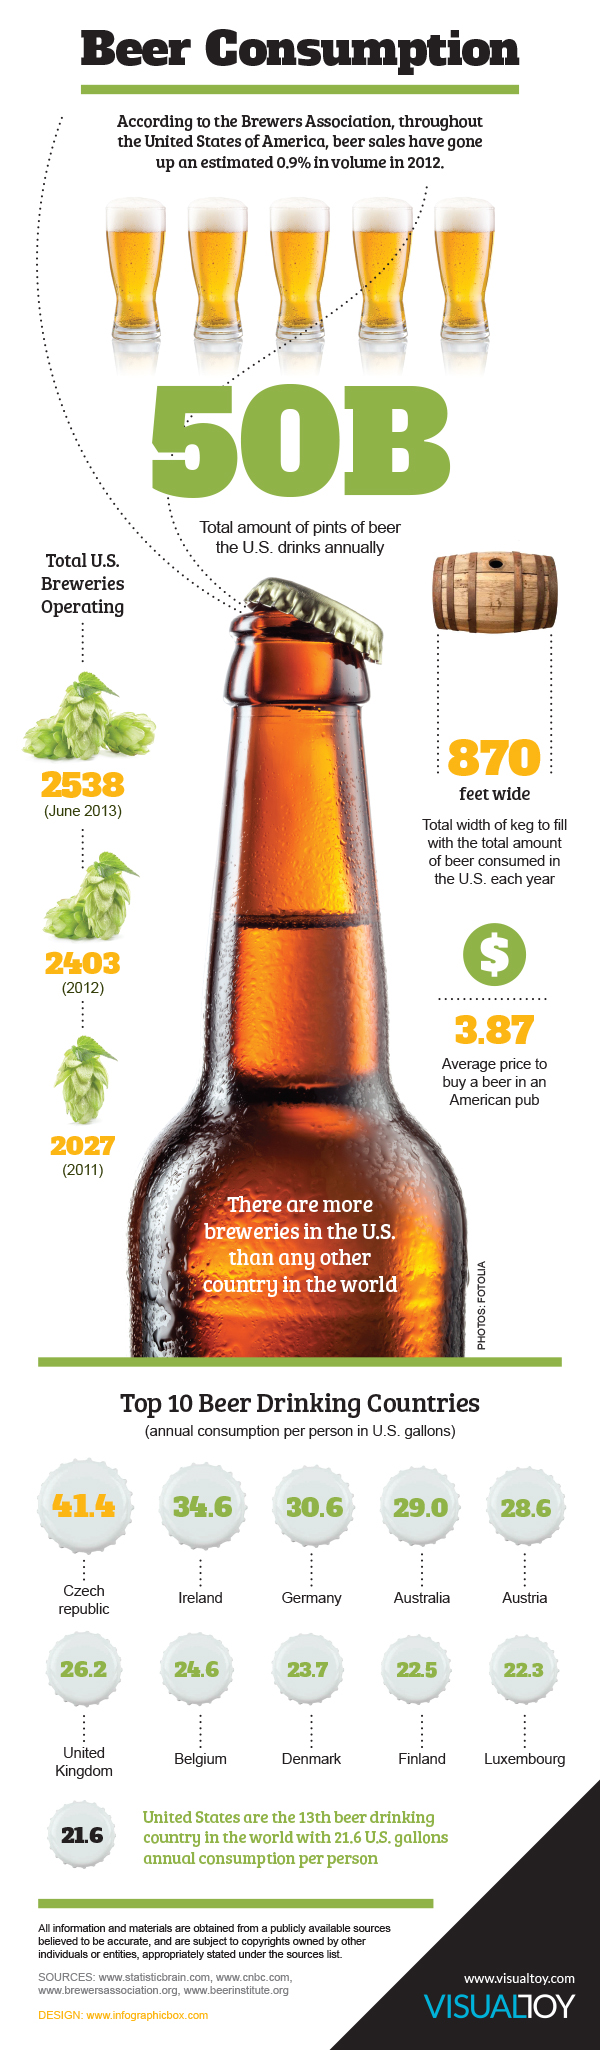
Today’s infographic shows Beer Consumption in the United States. It was created this year for Visual Toy Magazine, whatever that is.
Click here to see the infographic full size.

Today’s infographic shows Beer Consumption in the United States. It was created this year for Visual Toy Magazine, whatever that is.
Click here to see the infographic full size.

For our 79th Session, our host is Adrian Dingle, better known online simply as Ding through his Dings Beer Blog. Not surprisingly, he’s decided to shake things up with a provocative topic, the USA versus Old World Beer Culture.
Anyone with any inkling of my online, in-person and blogging presence in the American beer world since 2000, will know that the whole of my beer experience in that time has been colored by, sits against the backdrop of, and forms the awkward juxtaposition to, my English beer heritage and what has been happening the USA in the last few years. Everyone knows that I have been very vocal about this for a very long time, so when it came to thinking about what would be a great “Session” topic, outside of session beer, it seemed like that there could be only one topic; “What the hell has America done to beer?,” a.k.a., “USA versus Old World Beer Culture.”
This probably won’t be pretty, and you’re probably not gonna like it much, but hey, what’s new?

So on Friday, September 6, let the battle begin. What do you think America has done to beer? And in comparison, what about England? Are we at war? Are we having a beer war? Or is the “special relationship” intact? Grab your musket, a pewter tankard of some session beer (however you define it!) along with your laptop, and let slip the dogs of beer war.

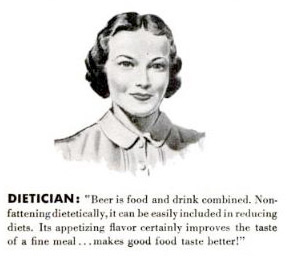
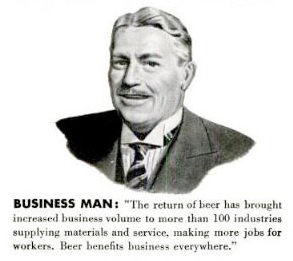
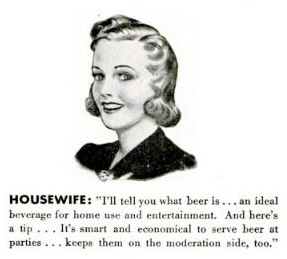
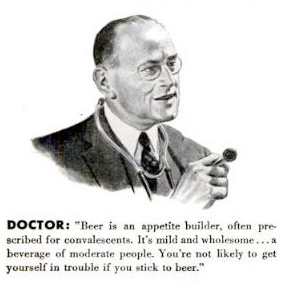
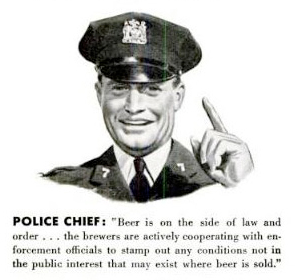
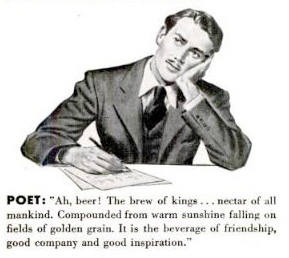
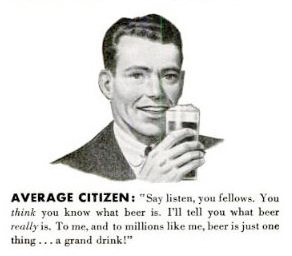
Today’s infographic is an oldie, but goodie, from 1940, in fact, when the United Breweries Industrial Foundation ran this in the January 15, 1940 issue of Life Magazine.
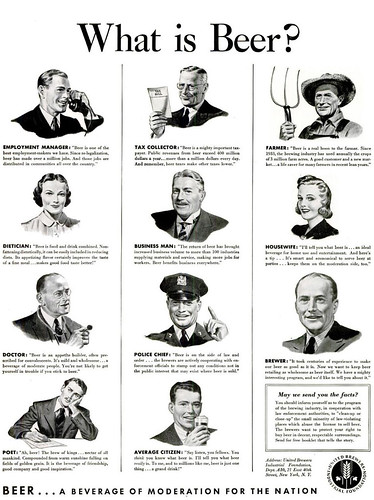
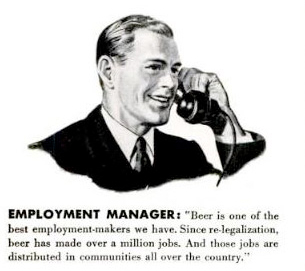
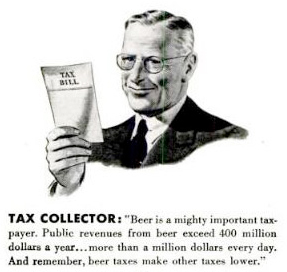
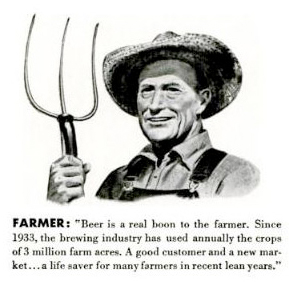
Below are close-ups of the eleven answers proffered to the question “what is beer?”


Today’s infographic comes from Next Generation Food, an EU website and shows you where you can buy the Top 10 Most Expensive Pints In The World, in British pounds. Topping the list, the United Arab Emirates. Though not part of the chart itself, the cheapest place for a pint is Panama, where 30p will get you a full glass of cerveza.
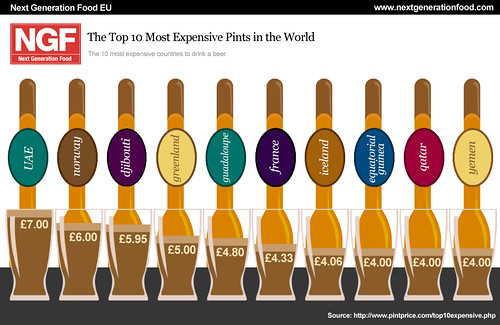
Click here to see the chart full size.

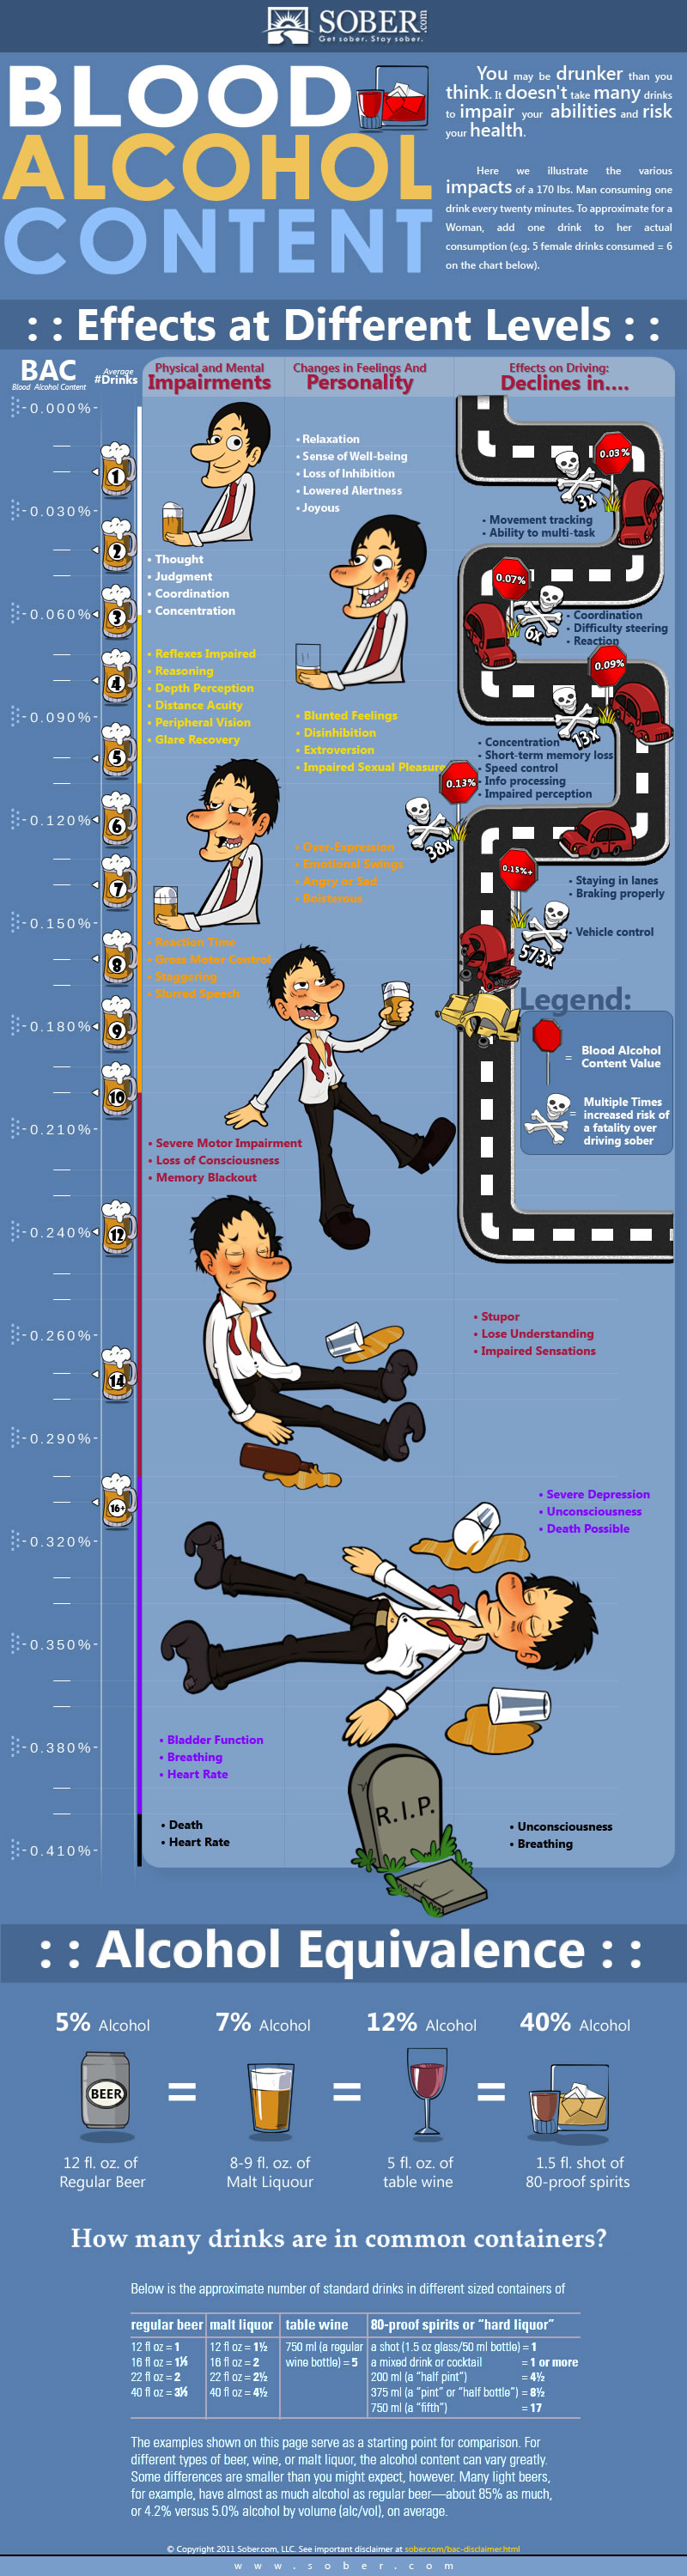
Today’s infographic, Blood Alcohol Content Effects At Different Levels, shows just that, moving from your first pint, at 0.000% BAC and proceeding to an untimely death at 0.410% BAC. It was created by Sober.com, a clearing house for treatment centers.
Click here to see the infographic full size.
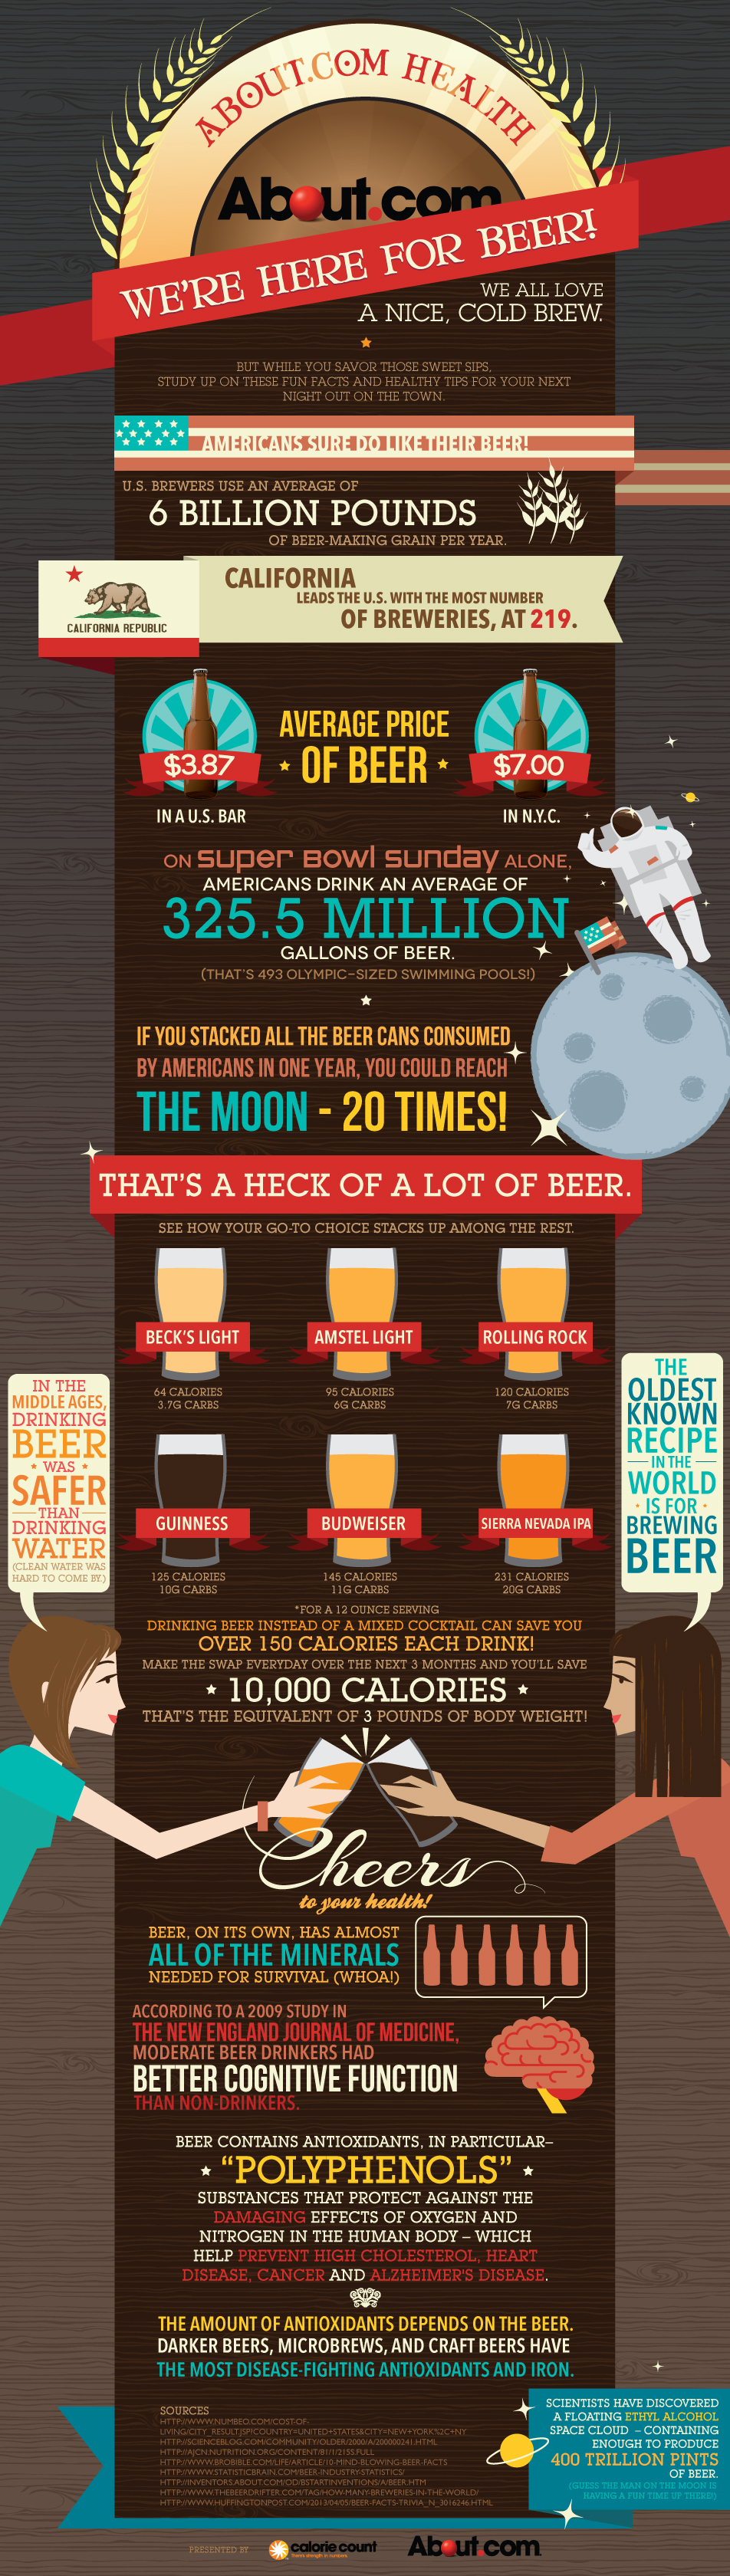
Today’s infographic was created by About.com Health, showing a broad overview of a few facts about — no pun intended — beer. They probably should have gotten Bryce Eddings, who writes About.com’s beer website, to help, as he most likely could have improved it.
Click here to see the infographic full size.

Today’s infographics has the engagingly entertaining title Earth: As Seen Through Beer, showing a global perspective of the biggest beer companies.

Today’s bonus infographic is also from Thrillist, and is entitled Red, White and Food. Like the earlier beer map, this one shows the most iconic fast food restaurant associated with each state, with this stated goal. “This is an attempt to maximize the most noteworthy restaurant chain (with an emphasis on fast food where possible) associated with each state. Could mean it was founded there. Could mean it’s headquartered there. Could mean both.”
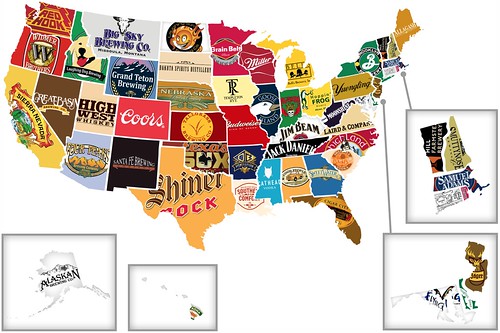
Today’s infographic is from Thrillist, and is entitled Red, White and Booze. The map shows the most iconic brand associated with each state, with the goal of “plotting the biggest/most high-profile liquor or beer companies from each of the 50. We know there are at least infinity amazing craft breweries in each of these states, but this map’s about the big boys, at least when there are big boys to be noted.”

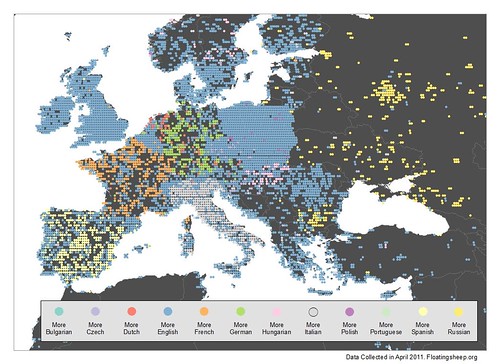
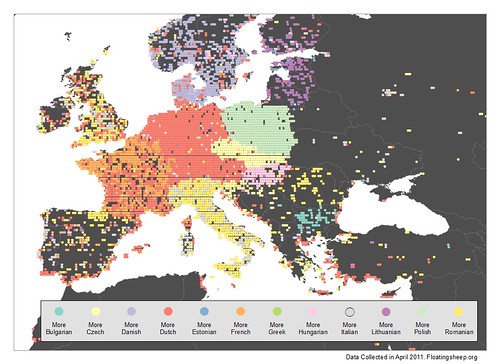
Today’s infographic graphs is similar to yesterday’s one showing “the relative prevalence of the word for beer in the world’s ten most spoken languages (by # of native speakers),” but instead shows the same metric for Europe. The map was also created by http://www.floatingsheep.org/2011/10/wherever-you-are-just-ask-for-beer.html”>Floating Sheep, and was a follow up to yesterdays.
Because simply mapping references to beer in the world’s most spoken languages yielded a relatively homogeneous result due to the significant number of references to “beer” and “ale” in English, we thought a more locally specific analysis would be appropriate. So we instead mapped references to beer in twelve languages spoken primarily in Europe that were not included in our earlier map. And while this map obviously doesn’t include all of the many languages spoken on the continent, these languages were chosen because of their relative prominence within a larger sample of languages.
Click here to see the map full size.
Despite the usefulness of this particular grouping, it remains useful to consider how some of the most spoken languages in the world stack up to these more country-specific languages, so in the map below we reintroduce references in English, as well as references in German, Portuguese, Russian and Spanish, to some of Europe’s more widely spoken tongues.
While this graphic complicates the picture provided by our first map — there continues to be a significant amount of content in the expected, native languages of each country — English remains prominent throughout Europe, especially in reference to beer.