
![]()
Today’s infographic shows the stages of the brewing process graphically. It’s called simply The Process of Brewing Beer.
World’s Strongest & Strangest Beers

Today’s infographic showcases the World’s Strongest & Strangest Beers, at least as of last year. Who knows what stronger or stranger beers have been released since then.
Periodic Table of Beer Styles

Today’s infographic is one of several versions of the Periodic Table of Beer Styles. It looks similar to the one hanging in my office, though mine has some color on it, while this one is strictly black and white.
The Price Of Beer Around The World
![]()
Today’s infographic tackles the Price of Beer Around the World. Djibouti has the highest priced beer while Panama has the cheapest.
How Alcohol Travels Through The Body

Today’s infographic concerns the subject of How Alcohol Travels Through the Body, each stage of the way and what happens at each place alcohol travels from mouth to liver and out again. Remember, you don’t buy alcohol, you just rent it. Just click on the image to view it full screen.
Slovak Beer Infographic
![]()
Today’s infographic is a fairly narrow one, in terms of its scope. It tackles beer in Slovakia. And although Slovak Beer uses a limited color palette, it still manages to communicate the information quite elegantly. I’d like to see one of these for every country.
Beer Tours of America

Today’s infographic is courtesy of Travel Insurance, and is entitled A Beer Tour of America. It’s geared toward the big boys and a few of the larger regionals, but if you were shopping for travel insurance, this would still be a far better way to spend your time.
You can see the chart full size at Travel Insurance.
Boozin’
![]()
There seem to be so many of these colorful infographics around these days that I could post one almost every day and not run out for a while. So here’s today’s, Boozin’ A Colorful Look at the U.S.’s Drinking Habits and How We Stack Up. One curious figure I noticed, especially given the whining of the neo-prohibitionists. We have one of the highest teetotaler percentages, WTF? That’s disappointing. Another factoid that stood out was that the heaviest drinking day of the year was the day before Thanksgiving, what they referred to as “Black Out Wednesday” — do I hear a new holiday being created? That surprised me, though while they do list sources at the bottom of the chart, it’s not clear where that one came from. I would have thought Halloween, or one of the summer big picnic holidays.
One Nation, Under Hops
![]()
The Geeks of the Industry blog, under his “Creative Strategist” tag, lists Craft Beer and the Thank You Economy as number 16. Here’s what the University of Oregon advertising student blogger had to say, presumably interpreted through his burgeoning education.
The craft brew industry is a prime example of a 21st century customer-brand dynamic. As you may know if you’ve been reading my blog, I am a bit obsessed with the philosophy of Gary Vaynerchuk and his views on what social media means to the present and future of branding. Microbrews and their cult-like support from many walks of life is a perfect example of the power of word of mouth in the 21st century. The village ecosystem of commerce is returning with the powerful viral capability of the passionate few.
Those sentiments are illustrated nicely with this clever infographic, created by Column Five Media for Visual.ly, under the title How Indie Brewers Are Outpacing Beer Industry Growth. I just love the proliferation of infographics, they are my Kryptonite. I am powerless to resist them. Enjoy.
The Science of Beer Goggles

Hmm, not sure how to think about this one. It’s kinda fun, and occasionally funny, but it also goes a little bit too far when it tackles the “bag over her face” issue, although it does offer advice for both women and men. The infographic was created by freedating.co.uk, an online dating website in Great Britain, so it was probably meant to be somewhat tongue in cheek.
There is actually some science behind the concept of beer goggles, and a couple of years ago I wrote about the Math Behind Beer Goggles. The infographic does also include some of that, too, at least.
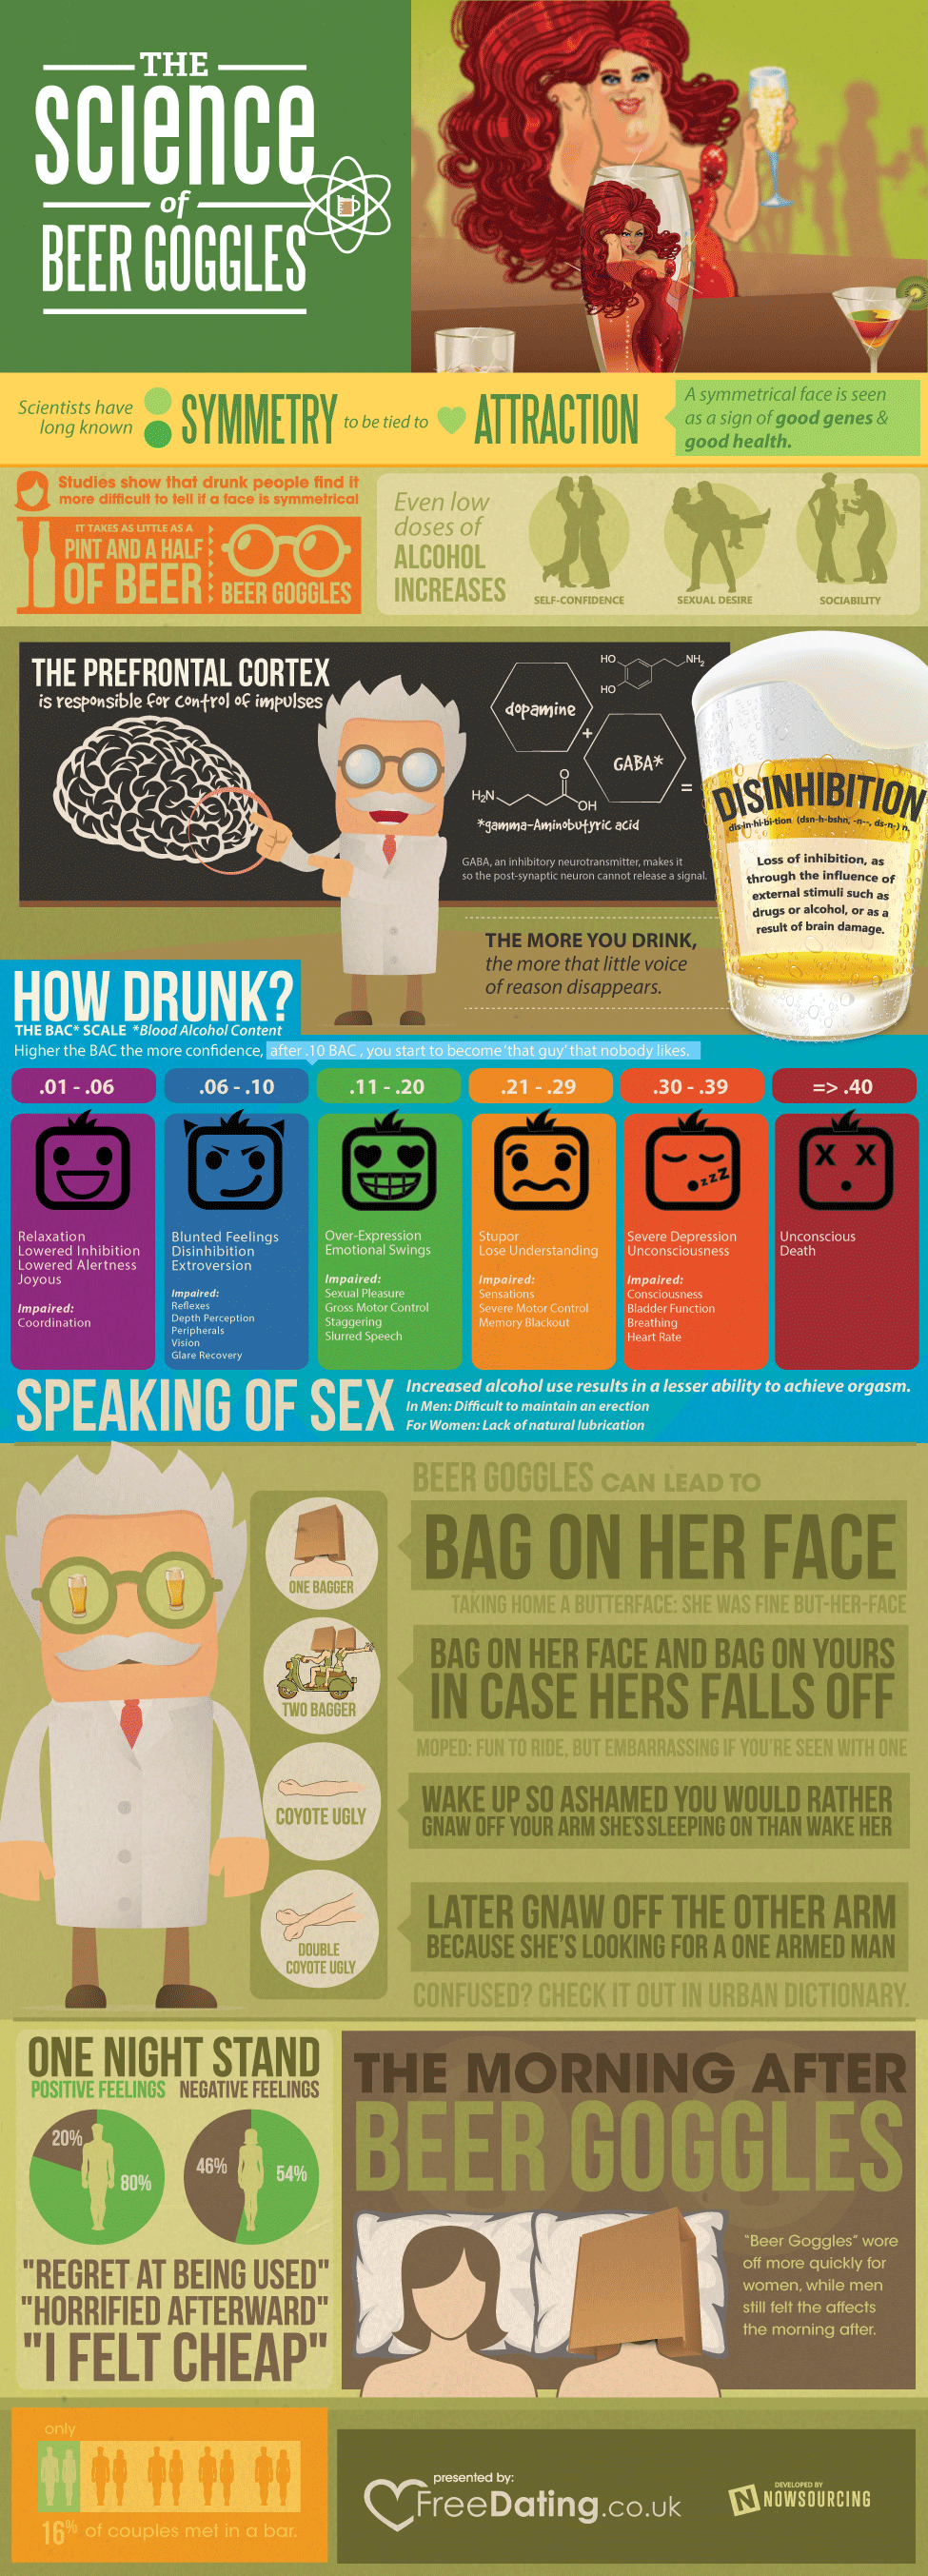
You can see this chart larger at Love Infographics.