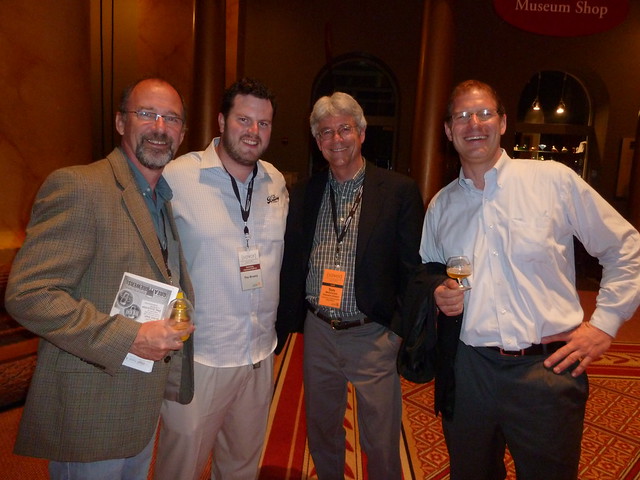
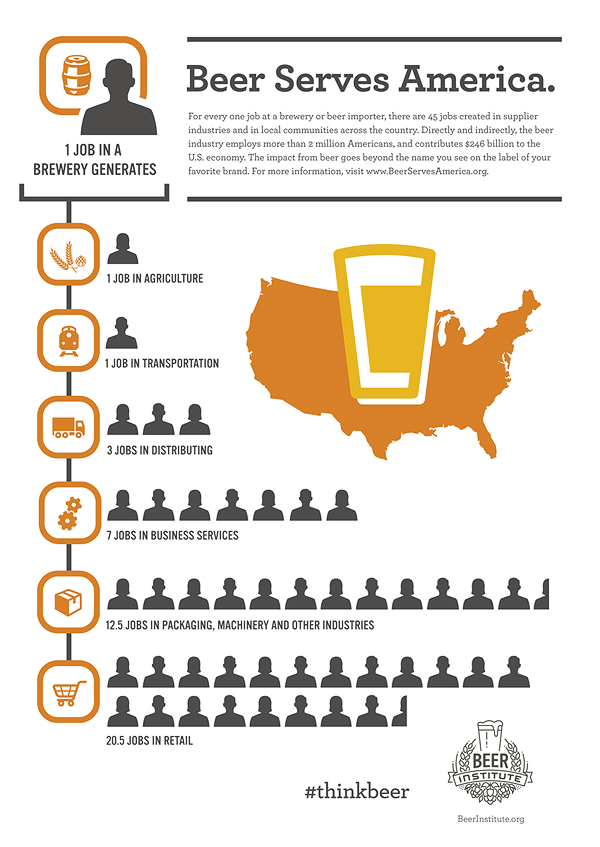
Brookston Beer Bulletin

Jay R. Brooks on Beer

  • Home
  • About
  • Editorial
  • Birthdays
  • Art & Beer

Socialize

  • Dribbble
  • Email
  • Facebook
  • Flickr
  • GitHub
  • Instagram
  • LinkedIn
  • Pinterest
  • RSS
  • Twitter
  • YouTube

Powered by Genesis

Beer Birthday: Lester Jones

April 5, 2025 By Jay Brooks

nbwa
Today is also the 58th birthday of Lester Jones. Lester was for a number of years the economist for the Beer Institute, the man who crunched all the numbers, including the great resource Beer Serves America, but a couple of years ago he moved over to do the same job for the National Beer Wholesalers Association (NBWA). As a big fan of the dismal science, I’ve gotten to know Lester well over the years and appreciate all that he does to help promote beer. He’s one of the good guys. Join me in wishing Lester a very happy birthday.

Lester Jones, of the Beer Institute & George Reisch, of Anheuser-Busch @ GABF Saturday
Lester with George Reisch, from ABI, at GABF in 2009.

P1000120
Lester with, from left: Daniel Bradford, Patrick Rue, and Tom McCormick at SAVOR in 2010.

Filed Under: Birthdays, Just For Fun Tagged With: D.C., Economics

Beer In Ads #2215: It Helps Support A Million Families

March 14, 2017 By Jay Brooks


Tuesday’s ad is a trade ad, by the United States Brewing Industry Foundation, from 1939. After prohibition ended, the industry started doing PSA-type ads in an attempt to create goodwill for beer and brewers. They would later go on to do a fairly sophisticated series of ads between 1946 and 1956, known unofficially as Beer Belongs. Officially, they were “The Home Life in America” series, consisting of 120 ads, with a new ad running in major periodicals each month. Last year, for my Beer in Ads series, I featured every one of them. But in the years before that, the U.S. Brewing Industry Foundation (a precursor to the original Brewer’s Association) dabbled with a variety of similar ads promoting the industry as a whole. These were especially popular during World War 2, and in fact they even won an award from the government for some of these ads. Most of the ads were black and white, although a few were in color, though usually in a minimal way, with a few colors accented rather than being in full color.

In this ad, another one not exactly subtle, the literal hand of “The Beer Industry” is holding up a giant beer tray filled with the million jobs the industry supports.

USBF-1939-employment

Filed Under: Art & Beer, Beers Tagged With: Advertising, Brewers Association, Economics, Economy, History

The Price Of A Beer: 1952-2016

March 9, 2017 By Jay Brooks

beer-money
I saw a slideshow recently on a genealogy website that took data from the Consumer Price Index from the Bureau of Labor Statistics and showed the price of a pint beginning in 1952 through last year, along with what that price would be in today’s money, in other words adjusted for inflation. I took it from a slideshow and turned into a table so you could more easily see the changes over time. Perhaps most surprising is that the average price of a beer is one-third less now than it was 64 years ago.

1-drink-bill

According to the data, the adjusted price for a pint peaked in the mid-1950s, 1956-57 to be specific. After that, the price has been coming down slowly but surely (with a few blips here and there) ever since. Part of that is undoubtedly efficiencies in both brewing and distribution. The on-and-off price wars that the big brewers engaged in over the last few decades must certainly have played a roll, as it kept prices artificially low across the board. At any rate, it’s interesting to see the prices all laid out like this over six decades. I’m sure others will see a lot more in the data, too.

wooden-nickel

Year
Price of Beer
Adjusted for Inflation
1952
$0.65
$5.93
1953
$0.65
$5.80
1954
$0.67
$5.93
1955
$0.67
$5.91
1956
$0.68
$6.01
1957
$0.69
$6.01
1958
$0.69
$5.82
1959
$0.70
$5.74
1960
$0.71
$5.77
1961
$0.71
$5.68
1962
$0.71
$5.62
1963
$0.72
$5.64
1964
$0.73
$5.64
1965
$0.74
$5.65
1966
$0.75
$5.63
1967
$0.76
$5.54
1968
$0.79
$5.61
1969
$0.82
$5.58
1970
$0.86
$5.58
1971
$0.89
$5.43
1972
$0.91
$5.32
1973
$0.94
$5.32
1974
$1.01
$5.38
1975
$1.09
$5.23
1976
$1.12
$4.93
1977
$1.15
$4.78
1978
$1.22
$4.76
1979
$1.32
$4.79
1980
$1.42
$4.63
1981
$1.52
$4.37
1982
$1.59
$4.14
1983
$1.65
$4.05
1984
$1.70
$4.04
1985
$1.75
$3.99
1986
$1.83
$4.03
1987
$1.88
$4.06
1988
$1.95
$4.06
1989
$2.03
$4.06
1990
$2.13
$4.07
1991
$2.35
$4.26
1992
$2.43
$4.22
1993
$2.47
$4.17
1994
$2.50
$4.10
1995
$2.54
$4.06
1996
$2.61
$4.05
1997
$2.68
$4.04
1998
$2.73
$4.08
1999
$2.80
$4.07
2000
$2.88
$4.09
2001
$2.95
$4.06
2002
$3.02
$4.04
2003
$3.08
$4.05
2004
$3.17
$4.08
2005
$3.23
$4.05
2006
$3.31
$4.01
2007
$3.41
$4.00
2008
$3.53
$4.03
2009
$3.64
$4.00
2010
$3.68
$4.06
2011
$3.73
$4.05
2012
$3.88
$4.00
2013
$3.87
$3.99
2014
$3.91
$3.97
2015
$3.95
$3.95
2016
$3.99
$3.99

nickel-beer

Filed Under: Beers, Just For Fun, News, Related Pleasures Tagged With: Economics, Statistics, United States

Beer In Ads #2204: Thanks A Million!

March 3, 2017 By Jay Brooks


Friday’s ad is a trade ad, by the United States Brewing Industry Foundation, from 1939. After prohibition ended, the industry started doing PSA-type ads in an attempt to create goodwill for beer and brewers. They would later go on to do a fairly sophisticated series of ads between 1946 and 1956, known unofficially as Beer Belongs. Officially, they were “The Home Life in America” series, consisting of 120 ads, with a new ad running in major periodicals each month. Last year, for my Beer in Ads series, I featured every one of them. But in the years before that, the U.S. Brewing Industry Foundation (a precursor to the original Brewer’s Association) dabbled with a variety of similar ads promoting the industry as a whole. These were especially popular during World War 2, and in fact they even won an award from the government for some of these ads. Most of the ads were black and white, although a few were in color, though usually in a minimal way, with a few colors accented rather than being in full color.

In this ad, the worker, the taxman and the farmer are all happier since beer was once again back after prohibition was repealed. That’s because since repeal, beer’s made one million jobs, the brewing industry’s paid a million dollars a day in taxes, and three millions acres of farmland dedicated to beer’s agricultural ingredients. Because, see, “even the non-beer drinker enjoy’s beer’s economic benefits!”

USBF-1939-thanks

Filed Under: Art & Beer, Beers Tagged With: Advertising, Brewers Association, Economics, History

NBWA Brewery Count Over 4,800

April 12, 2016 By Jay Brooks

nbwa
Some very interesting analysis from the NBWA, and their economist Lester Jones, about the number of breweries in America. Lester’s analysis uses slightly different metrics from the TTB and doesn’t define craft breweries as narrowly as the BA, and also the TTB doesn’t distinguish exactly what mat beverages are being made, if they’re licensed as a brewery then they’re included in the data. Those difference in calculating show the NBWA’s number for how many breweries there in America is 4,824, or over 550 more. But even more remarkable is that based on the number of “permitted breweries on record” at the TTB by the end of last year, that number could swell beyond 6,000, which seems absolutely crazy. The number is California alone, at 788, is just shy of 800. Sheesh!

Here’s the entire analysis below since the whole summary is worth reading:

Each year, the NBWA requests data from the TTB on tax paid withdraw volumes by size of brewery. Once again, this year’s TTB data provides some interesting brewing industry insights into the dynamics of the U.S. brewing industry. This data also is helpful for us to supplement the Brewers Association data on overall independent craft beer growth and brewery count. According to the BA, craft brewer volumes grew by 13 percent to 24.5 million barrels in 2015. The BA also reported 4,269 total operating breweries for 2015. As with all statistics, how the numbers are collected and reported can vary across organizations. In our industry, the numbers also change quickly.

As of April 2016, the U.S. domestic brewing industry had 4,824 reporting breweries according to the TTB. As with the BA’s brewery count of 4,269, this number is expected to change as additional new brewers are counted that may not yet have been fully recognized and/or reported by either the TTB or the BA data. The data presented below is for all types of malt beverage manufacturers and recognizes only the individual facility, not the ownership or control group.

Highlights from the 2015 TTB brewery count data include:

  1. The small brewer group (making less than 7,500 barrels) accounted for less than 2 percent of all domestic volumes yet accounted for 93 percent of all breweries. The smallest of this group has 566 breweries reporting less than one barrel of production each in 2015. These super small brewers can thank the contracting brewing industry for helping them sell almost 100,000 barrels – a figure well beyond their reported production capacity.
    The medium brewer group (making between 7,501 and 60,000 barrels) is a much smaller group consisting of 246 breweries, but these few breweries account for 1.6 times more volume than the 4,475 breweries in the small brewer group.
  2. The large brewer group consists of only 82 breweries making between 60,001 and 1.9 million barrels. This is a unique group within the industry as they pay the mixed rate federal excise tax of $7 for the first 60,000 barrels and $18 on each barrel over 60,001. While a much smaller group of only 82 breweries, they collectively produce more than four times the amount of beer as the medium brewer group. The large brewer group also has the largest range of production volumes and saw the fewest number of new entrants (17 breweries) into its ranks in 2015.
  3. Finally, we get the extra-large group. This is a group of only 21 breweries that produce more than 84 percent of all domestic beer – more than five times the amount made by all 4,803 combined. The closing of the MillerCoors brewery in Eden, North Carolina, will reduce this class of brewers by one in future reports and will take a significant-sized brewery offline for the first time in many years.
  4. The industry added around 1,500 new breweries in 2015 – that is equivalent to four new breweries a day entering the marketplace. As a highly capital-intensive business, starting small is the name of the game. Growing a beer brand takes a long time, and economies of scale are earned over decades. The largest U.S. breweries have been in operation for decades, and economies of scale should help maintain the beer volumes even in the face of declining per capita beer consumption.
  5. With more than 6,000 permitted breweries on record at the end of CY 2015, 2016 is set to be an even more competitive year for the brewing industry. Just as economies of scale drive the brewing side of the industry, logistical expertise and local market insights drive the efficiencies inherent in beer distributor networks. Working together and maximizing their comparative advantages, brewers, distributors and retailers will deliver unprecedented choice and value to American beer consumers in 2016.

Brewery counts by size 2015_Page_1

Brewery counts by size 2015_Page_2

Filed Under: Beers, Breweries, Just For Fun, News, Politics & Law, Related Pleasures Tagged With: Business, Distributors, Economics, Statistics

Economic Impact Of California Beer

May 6, 2015 By Jay Brooks

california
The California Craft Brewers Association (CCBA) recently commissioned an economic impact study of the state’s brewing industry for last year. And the news is pretty great. Here’s some of the highlights:

Economic Impact: In 2014 craft beer contributed more than $6.5 billion to the economy of California. That’s up 18% from 2013. That’s a fairly conservative number and they’ll have a more accurate and most likely higher numbers in June when the full report is finished. The craft beer industry in California has a higher economic impact than any other state in the US.

Employment: In 2014 Craft Brewers employed more than 48,000 Californians.

Growth: During 2014 the number of operating breweries grew by over 24% giving us a total of 520 operating breweries in California.

Taxes: In 2014 California craft brewers paid over $56 million in State and federal excise taxes and paid more than $1.3 billion in income and other local, state and federal taxes ($880 million in state and local income taxes and $465 in federal income taxes).

Production Volume: 3.5 Million Barrels

Exports: 1.3 million barrels. (That’s still higher than the total production of all but two other states (PA and CO)).

cal-econ-2015

Filed Under: Beers, Breweries, News, Politics & Law, Related Pleasures Tagged With: California, CCBA, Economics, Infographics, Statistics

Misusing Data

October 8, 2014 By Jay Brooks

data
As I’ve written time and time again, lying with statistics may not be the oldest profession, but it’s got to be pretty close. Alright, I may be exaggerating slightly. Modern propaganda and the P.R. machine got going around the time of the First World War, with many of the profession’s leading lights coming out of that time period — Edward Bernays, Walter Lippmann, Ivy Lee. But it’s a powerful tool of the propagandist today, especially the numerous prohibitionist groups and anti-alcohol organizations. So when I saw Think you drink a lot? This chart will tell you last month on the Washington Post’s Wonkblog, I noted it with suspicion and made a note to look at it closer when I had the time. What got my spidey senses tingling was the idea that “the top 10 percent of drinkers account for well over half of the alcohol consumed in any given year.” Here’s the chart the article ran, showing the data for that conclusion.

wonkblogchart

Although it shows the common Pareto Principle, it just didn’t ring true. That many people can’t, and don’t, drink that heavily. I knew there had to be another explanation for this data. And there is. Trevor Butterworth, writing for Forbes, did the heavy lifting on this one with his wonderful expose, When Data Journalism Goes Wrong. It turns out that when you drill down the data, looking at its source and analysis, things begin to unravel. Apparently the results of the original poll had the data manipulated by nearly doubling them to account for a perceived problem with under-reporting. To put that another way, the data was “fixed.” One of the problems with that (there are many, many, I’d say) is that people looking for data to support an agenda tend to seize on such manipulated data and pass it on, using it in their propaganda, and the mainstream media tends to fall for it uncritically, rarely looking at where the original information came from or how it was gathered. Happily, Butterworth does a good job of demonstrating where it all went wrong, and I urge you to read his entire When Data Journalism Goes Wrong. And a h/t to Maureen Ogle for sending me this. She knows me all too well.

Filed Under: Beers, Editorial, News, Politics & Law Tagged With: Anti-Alcohol, Economics, Prohibitionists, Statistics

Happy Labor Day: Beer Creates Jobs

September 1, 2014 By Jay Brooks

occupations
Happy Labor Day everybody. I thought this was a good day to highlight a press release from the Beer Institute about “how one job inside a brewery supports another 45 jobs outside. From farmers to factory workers, and truck drivers to tavern owners, beer puts people to work.” It’s not just that breweries employ a lot of people — they do — but many more job are created beyond the brewery that might not exist were it not for the beer. As their research shows, for every job inside a brewery, there are 45 related jobs outside the brewery.

BEER 3982 JOBS

From the press release:

“Today we toast to the industry’s 2 million men and women who make it possible for Americans to enjoy their favorite beer,” said Jim McGreevy, Beer Institute President and CEO. “America’s preference for beer is a huge boon to the national economy and the American worker.”

According to an economic study jointly commissioned by the Beer Institute and the National Beer Wholesalers Association in 2012, U.S. brewers and beer importers are the foundation for an industry that employs more than 2 million Americans, directly and indirectly. Beer also contributed $246.6 billion to America’s economy and generated $49 billion in local, state and federal taxes.

A Beer Institute analysis showed that each job in a brewery supports other jobs in the agriculture, business and personal services, construction, finance insurance and real estate, manufacturing, retail, transportation and communication, travel and entertainment and wholesale sectors.

They also broke down the number of jobs flowing from beer for each state. Not surprisingly, California was number one, with 241,640 contributing over $34 billion into the economy. After California, Texas, Florida, New York and Illinois have the most beer-related jobs, but even in the smallest states, thousands of people are gainfully employed thanks to beer. The total number of jobs nationwide is just over 2 million with a total economic impact of almost $247 billion. To see it broken down even farther, including by state and Congressional district, check out Beer Serves America.

Print

Happy Labor Day, the only this missing from this picture? Where are the brewers?

brewer-badge-2

Filed Under: Beers, Editorial, Just For Fun, News, Politics & Law Tagged With: Business, Economics, Economy, Holidays, Statistics, United States

Beer & Biodiversity

January 7, 2014 By Jay Brooks

biodiversity
I just stumbled on this fun little video comparing biodiversity in the world of nature to the beer industry. It was created by Minute Earth, a YouTube channel showing primarily science videos about our planet. I wonder what inspired them to create Dude beer?

Filed Under: Beers, Breweries, Just For Fun, Related Pleasures Tagged With: Business, Economics, Science, Video

Who Exports Beer?

October 13, 2013 By Jay Brooks

world-map
Today’s infographic is an interesting treemap created by the Observatory of Economic Complexity, a collaboration between M.I.T. and Harvard. This one, contrasting yesterday’s, shows the amount of beer exported by the nations of the world, with the size of their relative amount of exporting shown by the size of the rectangle.

who-exports-beer
Click here to see the treemap full size.

Filed Under: Beers, Breweries, Just For Fun, Related Pleasures Tagged With: Business, Economics, Infographics, International, Statistics

Next Page »

Find Something

Northern California Breweries

Please consider purchasing my latest book, California Breweries North, available from Amazon, or ask for it at your local bookstore.

Recent Comments

  • Return of the Session – Beer Search Party on The Sessions
  • Scoats on Beer Birthday: Scoats
  • You're Not From Around Here - Food GPS on The Sessions
  • Mark Smith on Beer In Ads #4778: Rheingold Can Quench A Dragon’s Thirst
  • Getting Ready to Celebrate St Patrick’s Day – The Blessing of Beer | Red Panda News on Beer Saints

Recent Posts

  • Historic Beer Birthday: Bert Grant May 17, 2025
  • Beer In Ads #4971: How To Serve, Drink And Enjoy A Good Glass Of Beer May 16, 2025
  • Beer Birthday: Gary Spedding May 16, 2025
  • Historic Beer Birthday: Maria Best May 16, 2025
  • Historic Beer Birthday: John Schneider May 16, 2025

BBB Archives