Brookston Beer Bulletin

Jay R. Brooks on Beer

  • Home
  • About
  • Editorial
  • Birthdays
  • Art & Beer

Socialize

  • Dribbble
  • Email
  • Facebook
  • Flickr
  • GitHub
  • Instagram
  • LinkedIn
  • Pinterest
  • RSS
  • Twitter
  • YouTube

Powered by Genesis

The Effect Our Significant Other Has On Our Drinking Habits

July 13, 2013 By Jay Brooks

bride-and-groom
Today’s infographic explores The Effect Our Significant Other Has On Our Drinking Habits. Since today is my 17th wedding anniversary — which is furniture or a watch, how romantic — so I’m posting For Better Or Worse, which shows how your marital status, by gender, affects your drinking patterns. Almost humorously, the infographic was created by Total Divorce.

the-effect-our-significant-other-has-on-our-drinking-habits
Click here to see the poster full size.

Filed Under: Beers, Just For Fun Tagged With: Infographics

CNBC Closing Bell: Craft Beer Reviving The Economy

July 12, 2013 By Jay Brooks

cnbc
The CNBC show Closing Bell had Brewers Association Craft Beer Program Director Julia Herz on the program earlier today. Despite the host showing some ignorance of beer and asking a few hostile questions, Julia held her own and did beer proud.

Filed Under: Beers, Breweries, Just For Fun, News, Related Pleasures Tagged With: Brewers Association, Mainstream Coverage, Video

Taking Over America’s Taste Buds

July 12, 2013 By Jay Brooks

ohio
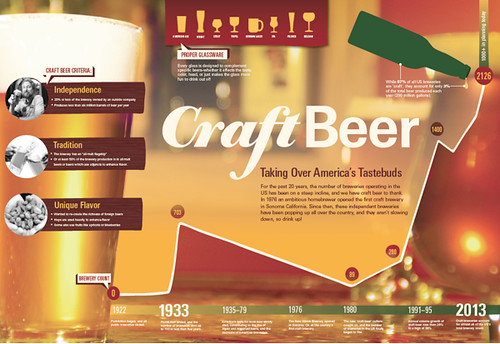
Today’s infographic, an overview of Craft Beer, Taking Over America’s Taste Buds, is not strictly about Ohio, but its creator, Molly Denning is from Columbus and created it as an Ohio State school project to be used in the Craft Beer Village at the Bunbury Music Festival, which begins today in Cincinnati.

craft-beer-tastebuds
Click here to see the infographic full size.

Filed Under: Beers, Breweries, Just For Fun Tagged With: Infographics, Ohio, Statistics

The Beer Belly Of America, Part 3

July 12, 2013 By Jay Brooks

beer-belly
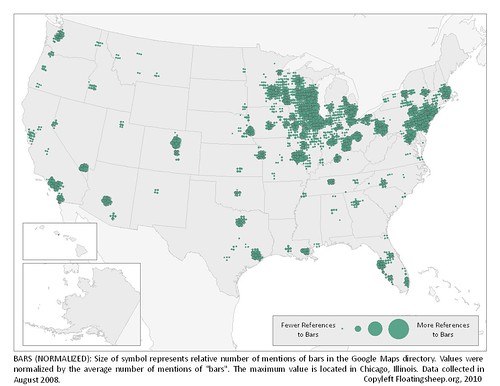
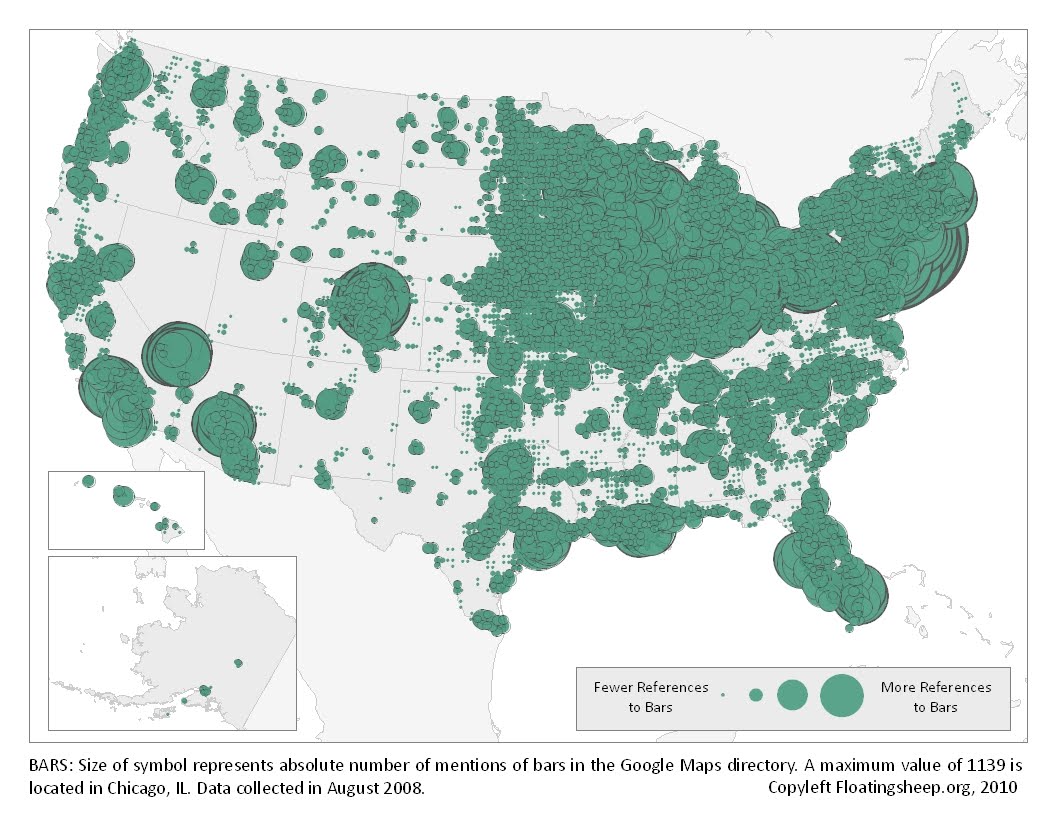
Today’s infographic is part three of three, created by Floating Sheep in 2010, using data collected in 2008. It’s from a post entitled the Beer Belly of America. The third map shows a more normalized version of yesterday’s map, showing the “relative mentions of bars in the Google Maps directory,” which was accomplished using the average number of bar mentions.

Beer-Belly-of-America-3
Click here to see the map full size.

Filed Under: Just For Fun Tagged With: Bars, Infographics, Statistics, United States

The Beer Belly Of America, Part 2

July 11, 2013 By Jay Brooks

beer-belly
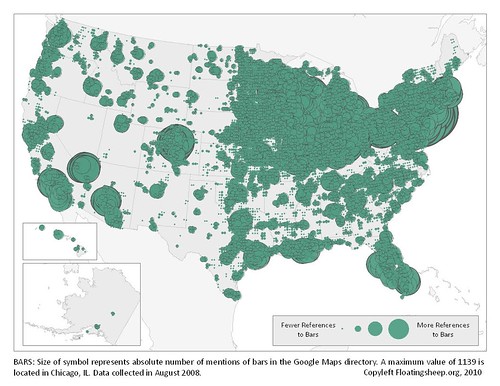
Today’s infographic is part two of three, created by Floating Sheep in 2010, using data collected in 2008. It’s from a post entitled the Beer Belly of America. The second map shows the “absolute mentions of bars in Google Maps directory.” Essentially it shows the location of every bar in America, and where the concentration of them is throughout the country.

Beer-Belly-of-America-2
Click here to see the map full size.

Filed Under: Just For Fun Tagged With: Bars, Infographics, Statistics, United States

The Beer Belly Of America, Part 1

July 10, 2013 By Jay Brooks

beer-belly
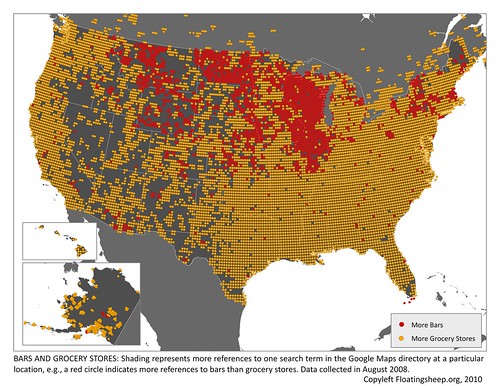
Today’s infographic is part one of three, created by Floating Sheep in 2010, using data collected in 2008. It’s from a post entitled the Beer Belly of America. The first map shows geographic references to bars vs. grocery stores, and where (in red) the bars are mentioned more frequently (and then they compared census data, which corroborated their findings).

Beer-Belly-of-America-1
Click here to see the map full size.

Filed Under: Just For Fun Tagged With: Infographics, Statistics, United States

How To Open A Beer Compilation

July 10, 2013 By Jay Brooks

opener-metal
My brother-in-law sent me this video this morning. There are a million ways to open a beer bottle, and this video includes a lot of different ones, including a few that seem pretty impractical (rendering the beer undrinkable) and some that look downright dangerous, but then there also some clever and funny ones, too. Enjoy.

Filed Under: Beers, Just For Fun Tagged With: Humor, Video

The Essential Map Of Europe & Environs

July 9, 2013 By Jay Brooks

european_union
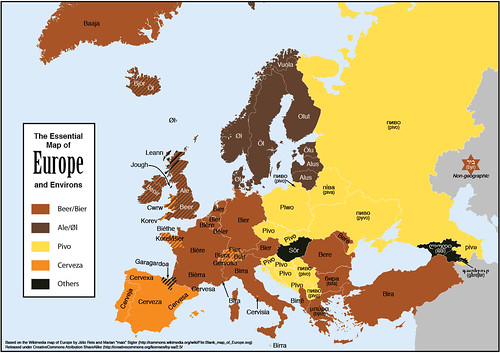
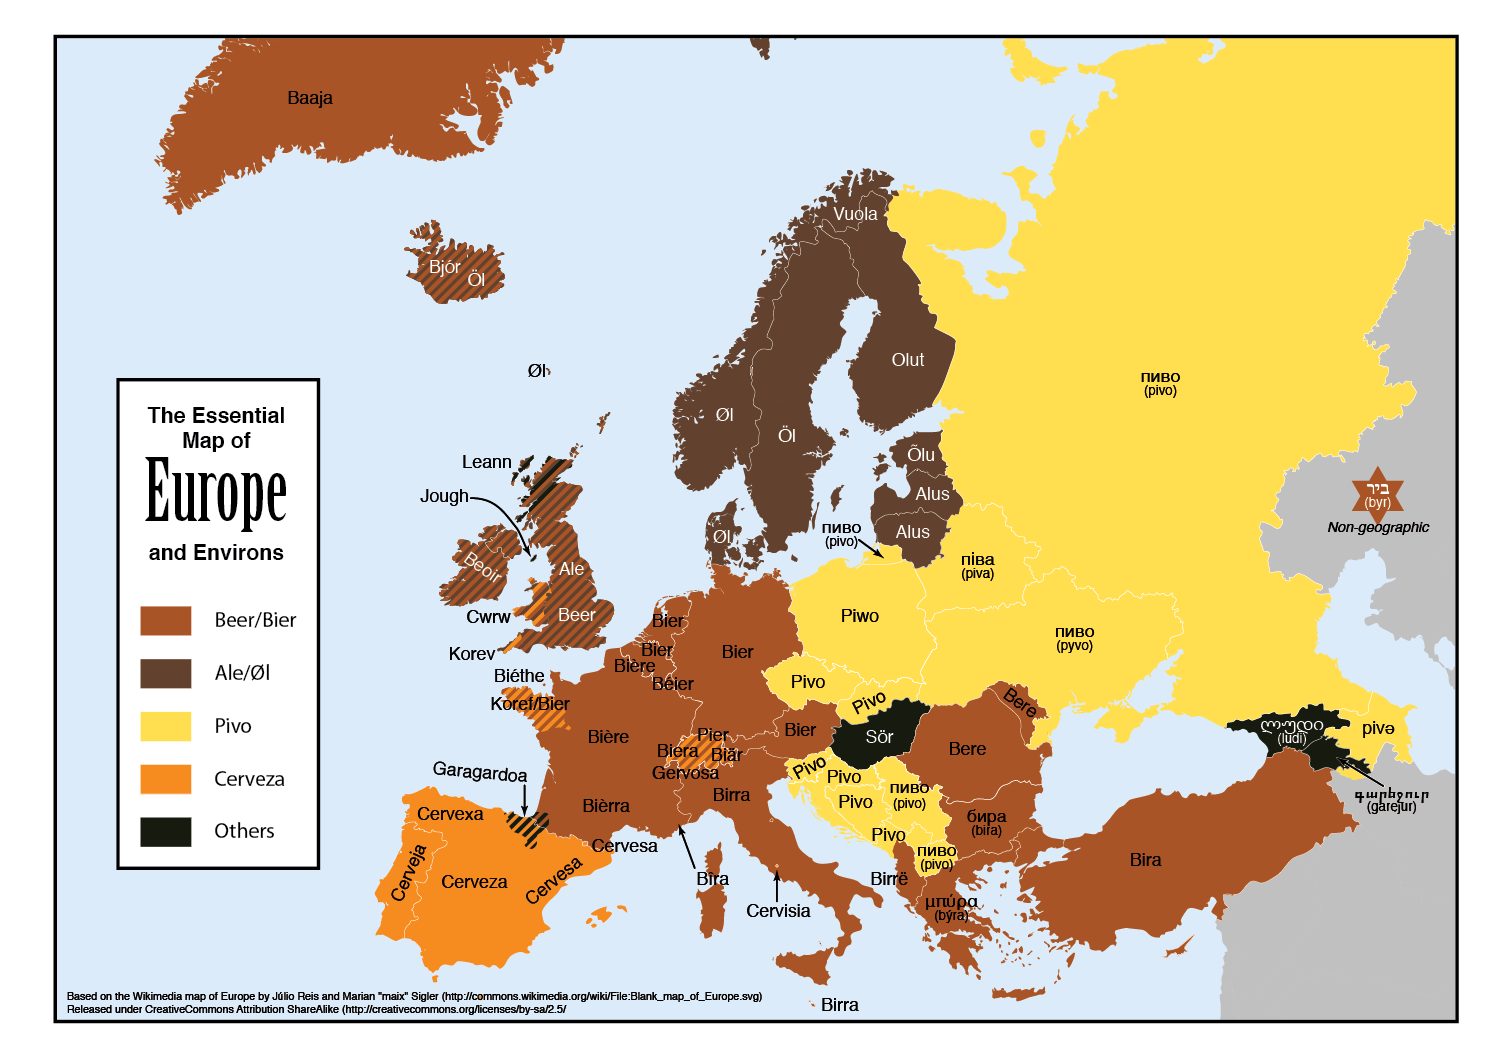
Today’s infographic was sent to me last night by my good friend Maureen Ogle, author of Ambitious Brew, and the soon-to-be-published In Meat We Trust. She knows of my love of language and especially beer words. I have my own growing collection of the word Beer in Other Languages, but Feòrag NicBhrìde of Scotland created the Essential Map of Europe and Environs, which is essentially a map showing the various ways in which Europeans refer to beer, helpfully divided by language types or origins.

essential-map-europe
Click here to see the map full size.

Filed Under: Beers, Just For Fun Tagged With: Europe, Infographics, Language, Words

Hop Flavour Spectrum

July 8, 2013 By Jay Brooks

hops
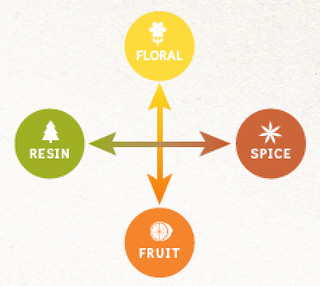
Today’s infographic is a Hop Flavour Spectrum, created by an Australian company HPA. They describe their Hop Flavour Spectrum as follows:

The Hop Flavour Spectrum has been created through years of research, experimentation and conversations with brewers, and by tasting a few beers along the way. It’s what we believe, and we want to build the spectrum with what you think too. Our hop varieties are divided into four flavour profiles: fruit, floral, spice and resin. This allows brewers to compare varieties and get an understanding of how each hop may impact the flavour of beer.

hop-flavor-spectrum

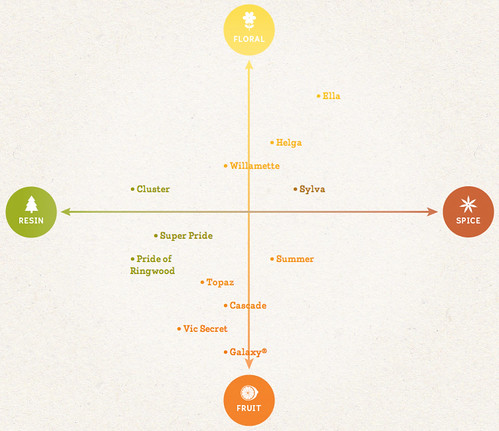
Then they took that scheme and placed the hops that their company carries on the spectrum, depending on each hops’ characteristics. Beverage World, in describing it, “The Hop Flavour Spectrum goes beyond the limitations of chemical analysis to provide an effective tool for comparing varieties and understanding how each hop may impact the flavor of beer.” You can click on each variety listed to see additinoal information about it. It would be cool to see even more varieties added to the spectrum.

hop-flavor-spectrum
CLick here to see the original interactive chart.

Filed Under: Just For Fun, Related Pleasures Tagged With: Australia, Hops, Infographics

The Science Of Getting Drunk

July 7, 2013 By Jay Brooks

science
Today’s infographic is entitled the Science of Getting Drunk, and shows what happens inside your body when you drink alcohol, how it affects the brain, identify different levels of drunkeness and also what it takes to get there. It was created by Best Colleges Online.

the-science-of-getting-drunk
Click here to see the infographic full size.

Filed Under: Just For Fun, Related Pleasures Tagged With: Infographics, Science

« Previous Page
Next Page »

Find Something

Northern California Breweries

Please consider purchasing my latest book, California Breweries North, available from Amazon, or ask for it at your local bookstore.

Recent Comments

  • Bob Paolino on Beer Birthday: Grant Johnston
  • Gambrinus on Historic Beer Birthday: A.J. Houghton
  • Ernie Dewing on Historic Beer Birthday: Charles William Bergner 
  • Steve 'Pudgy' De Rose on Historic Beer Birthday: Jacob Schmidt
  • Jay Brooks on Beer Birthday: Bill Owens

Recent Posts

  • Beer Birthday: Don Russell November 13, 2026
  • Beer In Ads #5391: Billy And The Judge November 12, 2026
  • Historic Beer Birthday: Michael Arthur Bass November 12, 2026
  • Historic Beer Birthday: Samuel Liebmann November 12, 2026
  • Historic Beer Birthday: Philip R. Ebling November 12, 2026

BBB Archives

Feedback

Head Quarter
This site is hosted and maintained by H25Q.dev. Any questions or comments for the webmaster can be directed here.