
![]()
This is a pretty funny video, JDirty and BIG Trox — GABF “Great American Beer Fest Rap”, made at last year’s Great American Beer Festival, which Charlie Papazian just tweeted. Enjoy.
Oktoberfest, By The Numbers

Today’s infographic is yet another poster about Oktoberfest, which began three days ago in Munich, Germany. This one is called the Oktoberfest, By The Numbers and was created by Julie Teninbaum for United Airlines’ Hemispheres.
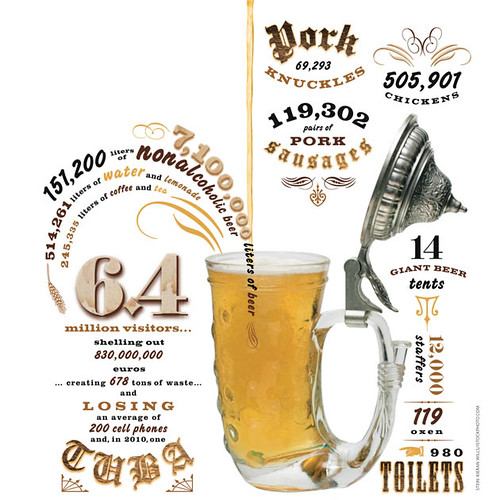
Click here to see the poster full size.
Per Capita Beer Consumption By State

Business Insider/Thrillist had an item not to long ago about per capita beer consumption by state, though they unceremoniously titled it The States That Guzzle The Most Beer. The data is based on information from the Beer Institute’s “Shipments of Malt Beverages and Per Capita Consumption by State 2012.” Business Insider made the statement that “the more unassuming states tended to out-booze their brethren, proving once again that you should always look out for the quiet ones silently pounding ales in the corner.” But whenever you look at per capita data, it always favors the less-populated states, and so doesn’t seem like a particularly accurate or meaningful measure of anything. It’s fun to see, but I don’t think you can draw too many grand conclusions from it. Here, for example, is the top ten.
- North Dakota
- New Hampshire
- Montana
- South Dakota
- Wisconsin
- Nevada
- Vermont
- Nebraska
- Texas
- Maine
Not surprisingly, Utah drinks the least, per capita, but the fact that New York and New Jersey are in the bottom five should tell you everything you need to know about how meaningless consumption by per capita can be. California, the most populous state, and with twice the number of breweries as any other state, ranks 44th, very near the bottom. Here’s the bottom five.
- Maryland
- New York
- New Jersey
- Connecticut
- Utah
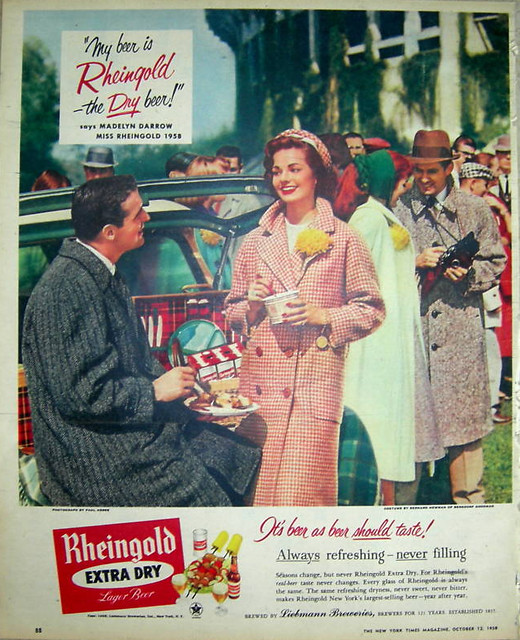
Beer In Ads #982: Tailgating

Monday’s ad is for Rheingold Beer, from 1958, and features Miss Rheingold from that year, Madelyn Darrow. It looks like she’s attending the most civilized tailgate party in the history of mankind.
BJCP Beer Style Video

This is a fun video that Ray Daniels tweeted about this morning. BJCP instructor Peter Campagna made a video showing bottles and cans representing each of the “76 Beer styles from the BJCP guide.”
The Down-Low On Oktoberfest
Today’s infographic is another poster about Oktoberfest, which began two days ago in Munich, Germany. This one is called the Down-Low on Oktoberfest and was created by Travel Insurance, which is an “online resource for travelers and people looking for more information on travel insurance.”
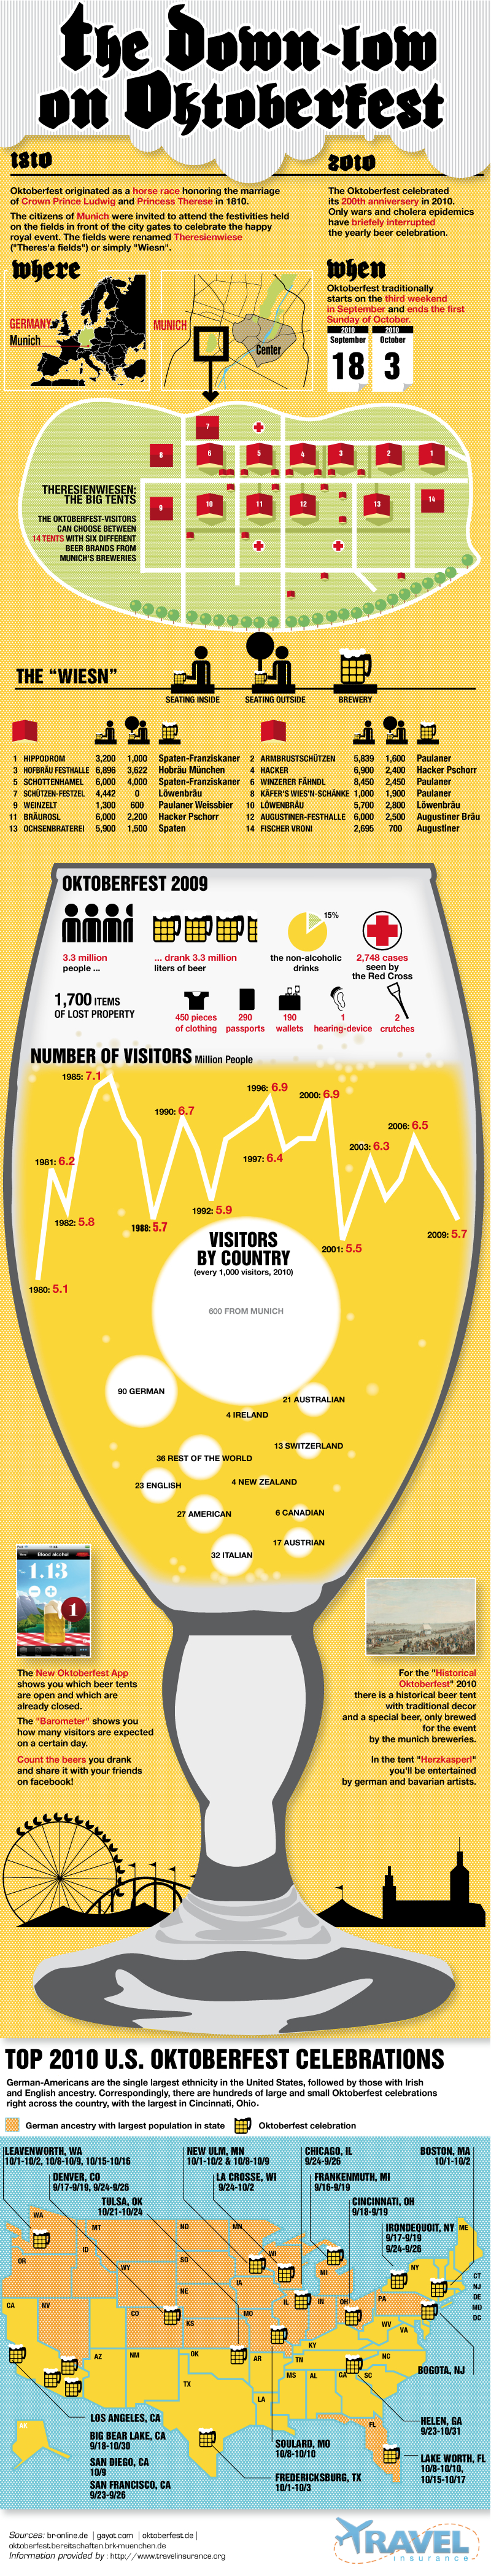
Click here to see the poster full size.
Oktoberfest Beer Rivers
Today’s infographic is a poster with various factoids about Oktoberfest, which began yesterday in Munich, Germany. It was created by a Russian website for last year’s festival.
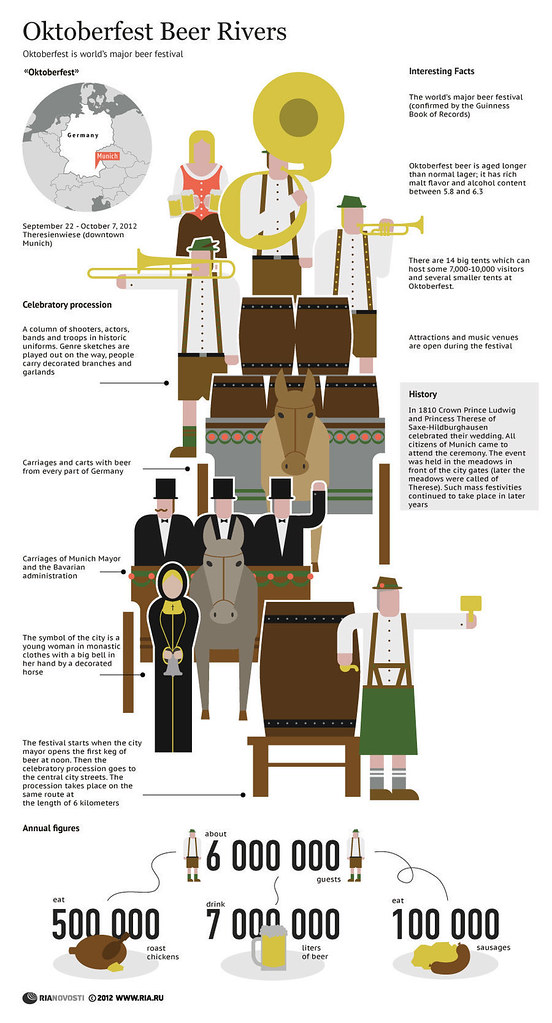
Click here to see the poster full size.
Tapping In On Oktoberfest
Today’s infographic is a poster entitled “O Zapft Is!” and showed various factoids about Oktoberfest, which begins today in Munich, Germany. It was created by Visible, a social media monitor company.
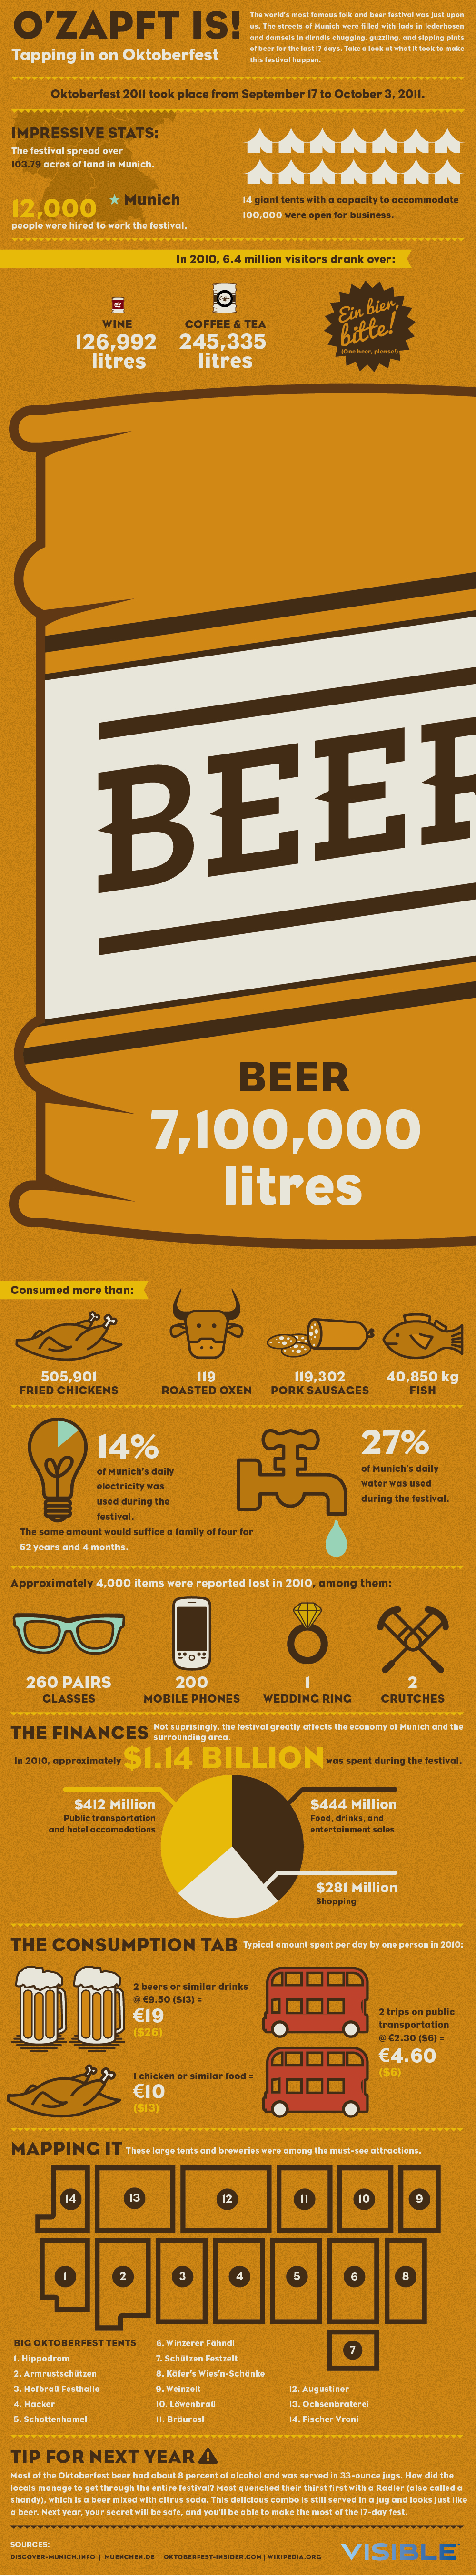
Click here to see the poster full size.
Beer In Ads #981: Nothing But Great Beer Taste
Friday’s ad is for Tuborg, from 1983. Showing “Today’s Tuborg,” which apparently is all about being “The Best of Both Worlds,” whatever that means. I only know what it doesn’t include.
No Jocks.
No Jokes.
No Cowboys.
No Horses.
No Mountains.
No Sunsets.
No Songs.
No Tricks.
No Gimmicks.
Nothing But Great Beer Taste.

The Difference Between Novice And Expert Beer Drinkers Infographic

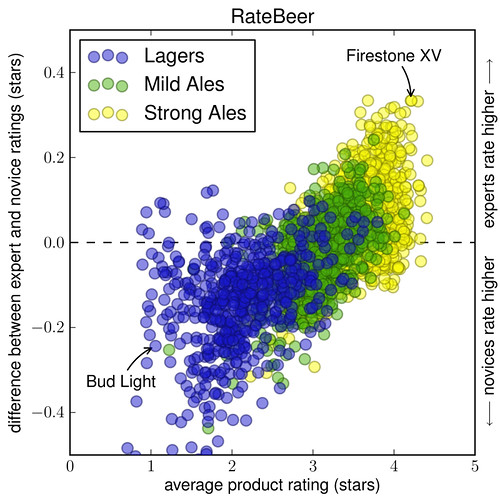
Today’s infographic is an interesting look at the Difference Between Novice And Expert Beer Drinkers, created by Business Insider, using a paper from earlier this year by Stanford University computer science post-doc Julian McAuley and assistant professor Jure Leskovec. The paper outlined “how our tastes change as we consume more products and gain more expertise,” but they then took it a step father, and applied their model to the beer reviews on RateBeer.
Click here to see the graph full size.
According to the Business Insider article, here’s what else they discovered.
The figure above shows the relationship between user experience and beer preference. McAuley and Leskovec broke down the beers into lagers, mild ales, and strong ales, and then calculated each beer’s individual ranking by experience level.
The x-axis shows the average rating of products on the site (out of 5 stars), while the y-axis shows the difference between expert and novice ratings.
According to their study, while beginners and experts have similar top beers, experts tend to have stronger opinions than novice users. They explain in the study:
While a lager such as Bud Light is disliked by everybody, it is most disliked by experts; one of the most popular beers in the entire corpus, Firestone XV, is liked by everybody, but is most liked by experts.
They also found that more-experienced users gave higher ratings to almost all strong ales, illustrating that these types of beer are more of an acquired taste than traditional lagers.