

Today’s infographic is another one from Lug Wrench, this one all about Alcohol By Volume Ranges By Style, showing the BJCP styles with the range of a.b.v. for each.

The History Of Beer

Today’s infographic is entitled The History of Beer, and was created by the Black Sheep Brewery in the UK.
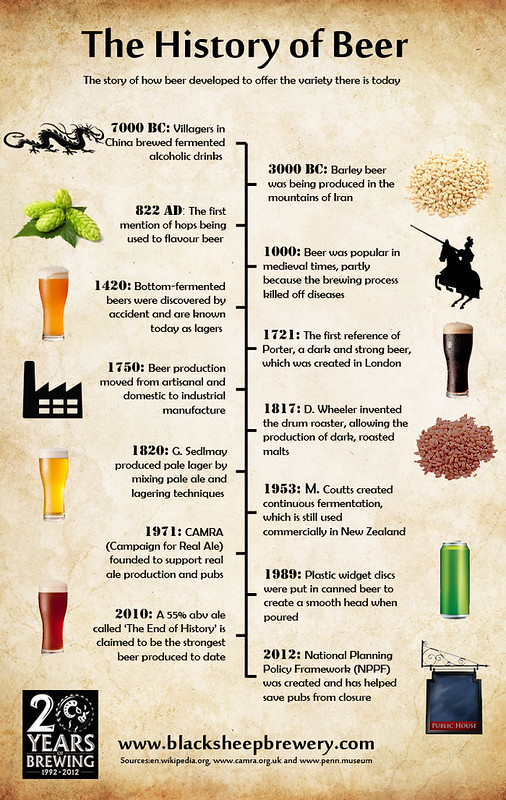
Click here to see the poster full size.
Das Bier
![]()
Today’s infographic is a poster of different common types of beer called Das Bier. It was created by Lemonwood Design.

Click here to see the poster full size.
So You Want To Save Water?
![]()
Since today is World Water Day, our infographic for the day is So You Want To Save Water? Though it’s not strictly about brewing or beer, it seems relevant since water is the biggest ingredient used in brewing beer. Two interesting mentions of beer are in the poster. The first is that it takes 19.81 gallons to produce a glass of beer. I’m not sure about the exact number, but I do know many brewers are aware of their own water ratio and work hard to lower it. The second is that you can save 15,582 gallons of water per year if you switched from a daily glass of milk to a daily glass of beer. Now that’s conservation I can get behind.
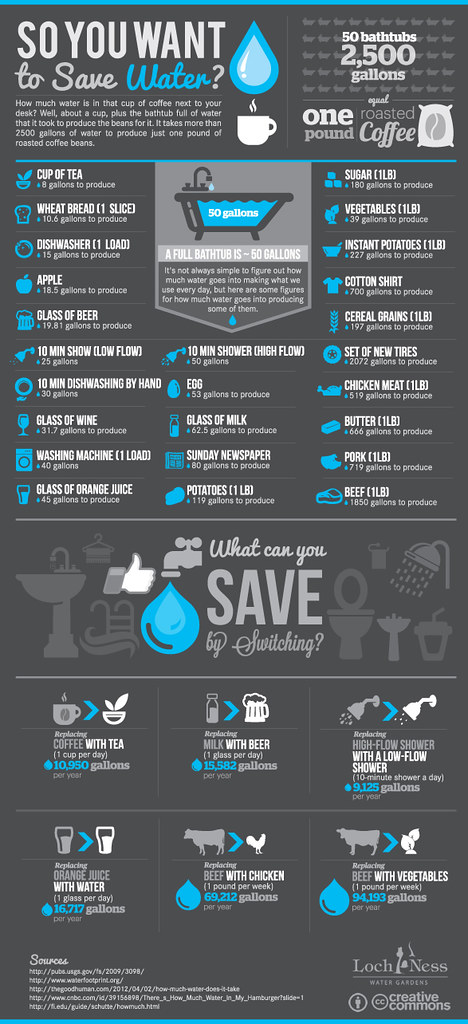
Click here to see the infographic full size.
Rocket Science Behind Hangovers
![]()
Today’s info graphic is titled the Rocket Science Behind Hangovers, from Rahul Desai’s Blog, showing how alcohol effects particular parts of the body, and how they lead to a hangover.
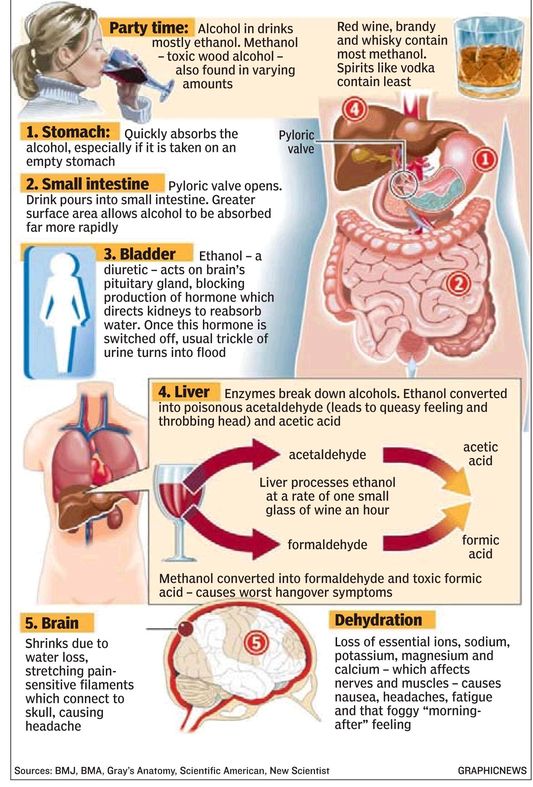
Click here to see the poster full size.
The Case For Beer

Today’s infographic, The Case For Beer: Why You Should Enjoy It & Enjoy It Right, comes to us from Frugal Dad, who tells us: “There are times when learning a few key pieces of information about something can help you to maximize the value you get from it.” And that was the goal with this, offering some basic information for the person new to beer.

Click here to see the infographic full size.
Field Guide To Hops

Today’s infographic comes from the homebrewing book Beer Craft: A Simple Guide to Making Great Beer, by William Bostwick and Jessi Rymill. Dwell magazine did a profile of the book, including this page with their Field Guide to Hops.
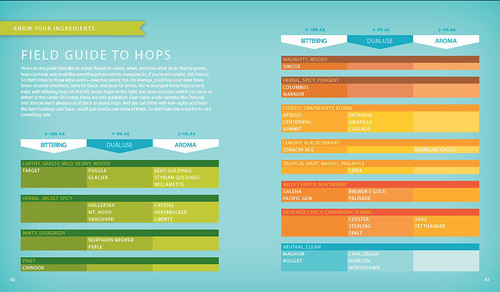
Click here to see the field guide full size.
Craft Beer Growth Continued To Skyrocket In 2012
![]()
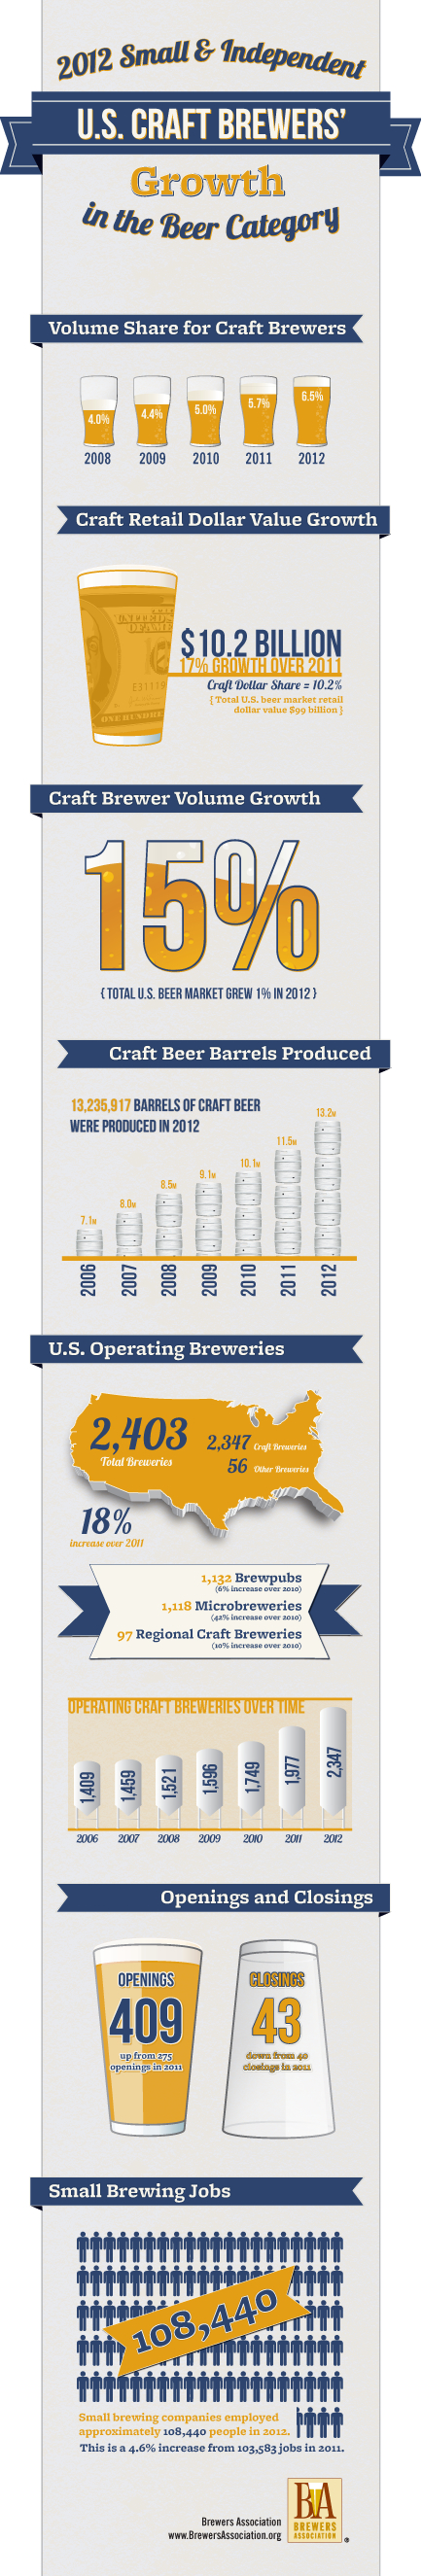
Today’s infographic is a timely one, and was released just this morning. The Brewers Association today released the preliminary numbers for beer sales last year. Not surprisingly, the 2012 numbers look great, and continue the trend in recent years of forward momentum for craft beer. The big news is simple. “In a year when the total U.S. beer market grew by one percent, craft brewers saw a 15 percent rise in volume and a 17 percent increase in dollar growth.”
But here’s a bit more, from the press release:
With production at 13,235,917 barrels in 2012, craft brewers reached 6.5 percent volume of the total U.S. beer market, up from 5.7 percent the previous year. Additionally, craft dollar share of the total U.S. beer market reached 10.2 percent in 2012, as retail dollar value from craft brewers was estimated at $10.2 billion, up from $8.7 billion in 2011.
Also, the number of breweries continues to rise at an amazing pace. The surprising thing to notice is that the growth is almost entirely in production breweries, which increased 44%!
In 2012, there was an 18 percent increase in the number of U.S. operating breweries, with the total count reaching 2,403. The count includes 409 new brewery openings and only 43 closings. Small breweries created an estimated 4,857 more jobs during the year, employing 108,440 workers, compared to 103,583 the year prior.
And here’s all of that good news, distilled into a colorful infographic.
Drink Like The Irish
![]()
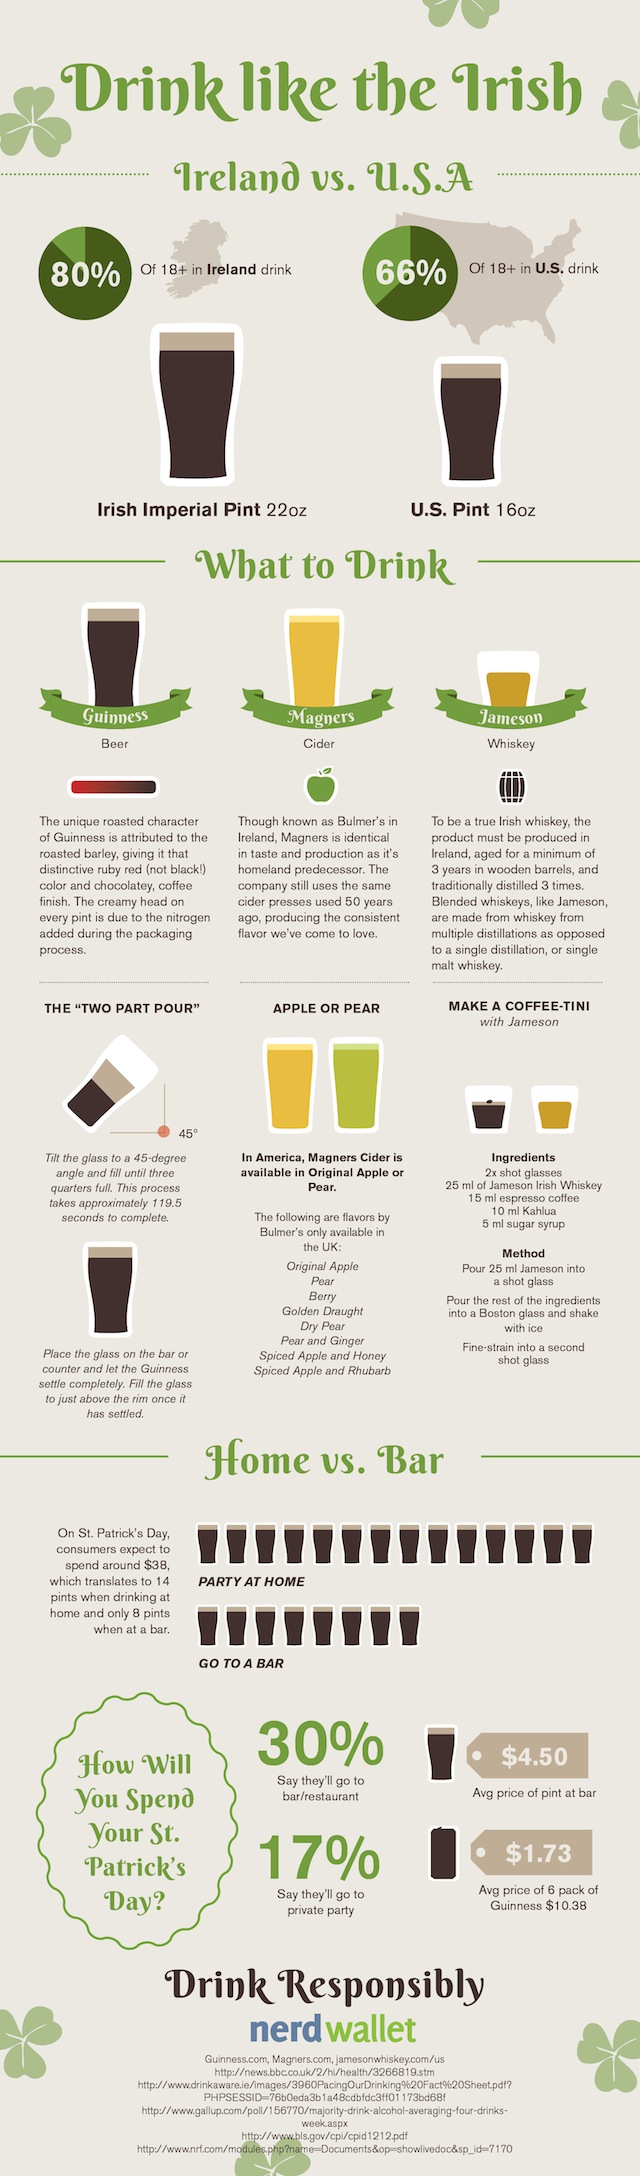
Today’s infographic is from NerdWallet, and is part of a story on St. Patrick’s Day trends in how people are celebrating this year. In Study: Consumers Can Save $2.6 Billion By Avoiding Pubs and Sticking to House Parties This St. Patrick’s Day. I’m not sure if I’m convinced, although I’ve avoided going out for St. Patrick’s Day for years. Still, some interesting bits of information.
Funky Brewsters
![]()
Today’s infographic is a funny one, and comes from the Huntsville Beer Week, which took place in Alabama last October. The local paper created a fun poster for the event, entitled Funky Brewers, which anthropomorphized various styles of beer, giving them unique personalities that corresponded to the character of their flavors. It was created by the staff of the Huntsville Times and illustrated by Bethany Bickley, and the whole process is explained in Brewing up something special for the weekly entertainment tab in Huntsville, Ala. at the website of the American Copy Editors Society. To fully appreciate the humor, not all of which works, you really need to see it full size.

Click here to see the poster full size.