Brookston Beer Bulletin

Jay R. Brooks on Beer

  • Home
  • About
  • Editorial
  • Birthdays
  • Art & Beer

Socialize

  • Dribbble
  • Email
  • Facebook
  • Flickr
  • GitHub
  • Instagram
  • LinkedIn
  • Pinterest
  • RSS
  • Twitter
  • YouTube

Powered by Genesis

Spirits Still Gaining On Beer’s Market Share

February 1, 2012 By Jay Brooks

spirits-wine-beer
The Distilled Spirits Council, a trade organization for producers of distilled spirits, just released their annual report on how spirits are doing relative to the other alcoholic beverages. Vodka continues to lead the spirits parade, with rum in second and tequila in third.

alcohol-sales-2011

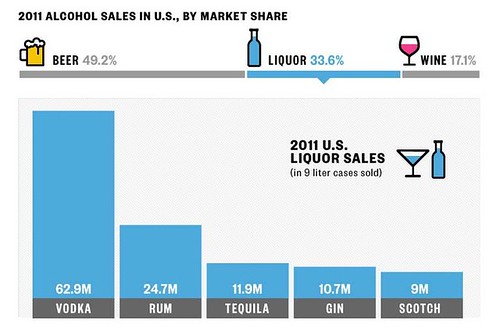
While beer continues to be the most popular adult beverage, spirits once again took market share from beer, which was up 4% by sales in 2011 over 2010. According to their figures, beer currently enjoys 49.3% of the alcohol market, with spirits having 33.6% and wine 17.1%. [Note: I can’t account for the 0.1% difference in the two charts. They’re supposedly taken from the same source, though the one below is directly from the Distilled Spirits Council.]

spirits-wine-beer-2011

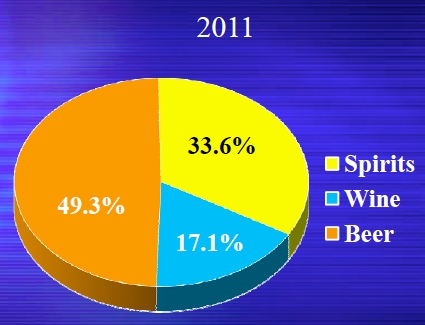
While 49.3% sounds pretty good, the year before it was 49.8%

spirits-wine-beer-2010

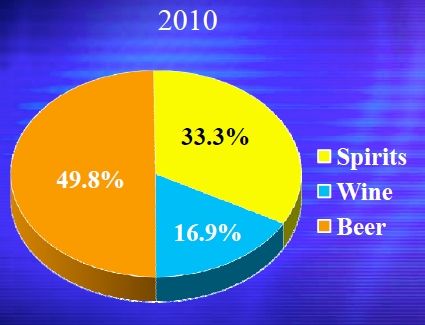
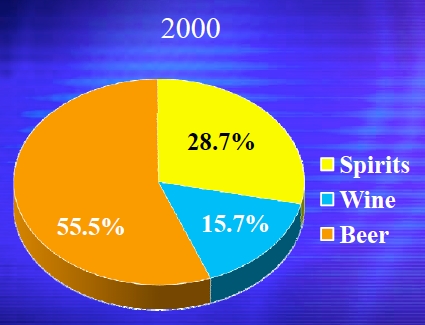
And in 2000, only 11 years ago, it was 55.5%, meaning beer has lost 6.2% marketshare in just over a decade. Hey, beer people; you’re just not pulling your weight. Drink a few more beers tonight. A can (or bottle or pint) a day, that’s all we ask.

spirits-wine-beer-2000

Filed Under: Beers, News, Related Pleasures Tagged With: Business, Craft Spirits, Statistics

Coors Light: Now The Avis Of Beers

January 14, 2012 By Jay Brooks

coors-light
I’m not exactly sure why this appears to be such big news, but it seems to be everywhere. Beer Marketer’s Insights is reporting that, based upon estimated numbers for 2011, Coors Light has overtaken Budweiser to become the 2nd best-selling beer in America. According to the report, “[t]his is the first time in almost 20 years, since 1993, that AB didn’t have top 2 brands.” But I note that according to IRI data, Miller Lite held the #2 spot at least as recently as 2007. Though to be fair, it’s true that Bud Light and Budweiser have enjoyed the top two spots, if off and on, for quite some time.

But the story isn’t so much about Coors Light being up (they were, but only 0.8%). What’s more interesting is that Budweiser was down 4.6%, which had more to do with the switch in positions. InBev seems to be struggling with the A-B core brands ever since they took over Anheuser-Busch. It can’t help that they’ve laid off countless employes, bullied suppliers and lost a great deal of goodwill through their cost-cutting way of doing business. They don’t seem to have the same relationship with consumers that the company did when it was run by the Busch family. And while the big breweries are losing ground to craft beer overall, ABI seems to losing more. So it makes sense that another brand would pick up the slack, catapulting Coors Light into the number two position, a spot Avis once upon a time used to great effect in their advertising. Maybe we’ll see Coors do something similar. “Coors Light is No. 2 in beer. We try harder.“

Filed Under: Beers, Breweries, Just For Fun, News Tagged With: Big Brewers, Business, Coors, Statistics

Yuengling Becomes Biggest American Brewery

January 13, 2012 By Jay Brooks

yuengling-eagle
According to new estimated beer sales data for 2011 from Beer Marketer’s Insights, Yuengling Brewery in Pottsville, Pennsylvania has now eclipsed the Boston Beer Co. (makers of Samuel Adams) to become the biggest American brewery. Yuengling’s area newspaper, the Lehigh Valley’s The Morning Call, had the story this morning. The numbers shake out like this:

Yuengling sold 2.5 million barrels of beer in 2011, up 17 percent from the previous year, according to Beer Marketer’s Insights in Suffern, N.Y., a magazine that tracks the beer industry. Boston Beer sold 2.4 million barrels in 2011, the magazine estimated.

Boston Beer, a public company, has yet to release final sales for 2011. Beer Marketer’s Insights based its estimate on Boston Beer sales in the first three quarters and the company’s own sales forecast for the fourth quarter.

Even if Boston Beer had a surprisingly good fourth quarter, it wouldn’t close the gap with Yuengling, said Eric Shepard, editor of Beer Marketer’s Insights.

The Morning Call also created the chart below to illustrate the shift in sales between the two companies over the last five years.

yuengling-vs-boston-beer-2010

Filed Under: Breweries, News Tagged With: Business, Statistics, United States

The Absurdity Of Binge Drinking Statistics

January 11, 2012 By Jay Brooks

binge-barney
This is one of those things that’s increasingly pissing me off, because it avoids real problems that some people have with alcohol in favor of trying to turn individual problems into an epidemic. It’s not. If anything, overall consumption of alcohol is decreasing. But it’s hard to get funding, finance addiction clinics and raise money to fight the scourge of alcohol if you don’t make the situation sound as dire as possible.

Take binge drinking, for example. ABC News just did a story (thanks to Julia Herz for tweeting it) about a “new” report claiming that 38 million Americans “binge drink an average four times a month.” Their story, entitled CDC: Millions of Americans are Binge Drinkers, details how the CDC is claiming that 1 in 6 “adults binge drinks about four times a month, and on average the largest number of drinks consumed is eight.” Not only that, but this is apparently on the rise. Here’s what the CDC website has to say.

New estimates show that binge drinking is a bigger problem than previously thought. More than 38 million U.S. adults binge drink, about 4 times a month, and on average the largest number of drinks consumed is eight. Binge drinking is defined as consuming four or more drinks for women and five or more drinks for men over a short period of time.

In the ABC report, Dr. Fulton Crews, director of the Center for Alcohol Studies at the University of North Carolina at Chapel Hill is quoted in what must be one of the most out-of-touch statements ever made on this subject. “But most people don’t realize that binge drinking is unhealthy.” Seriously? Is there anyone who hasn’t been bombarded with neo-prohibitionist propaganda, whether it’s our government, MADD, Alcohol Justice or some other anti-alcohol group. My kids started receiving the message literally in kindergarten, before they were even able to process it. There isn’t a man or woman alive who believes that drinking too much is good for you.

What people might not know is that what it means to be a “binge drinker” is not as concrete as these “reports” insist. How binge drinking is defined keeps changing, and always it’s narrowing, pulling more people into the circle of binge drinkers, not because they’re suddenly drinking more, but because how it’s defined has changed. I don’t want to repeat myself too much, but I detailed some of the history of this transformation a couple of years ago, in two posts entitled Inflating Binge Drinking Statistics and Son of Binge Drinking Statistics Inconsistencies. And the year before that I wrote about it in Inventing Binge Drinking. What’s clear is that binge drinking went from something somewhat vague — you knew it when you saw it — to ever more specific definitions, the kind that could be quantified and used to alarm people, and, by no small coincidence, be used by anti-alcohol folks in their propaganda.

So yet again the definition seems to be changing. The actual number of “too many” drinks has been somewhat fixed for the last few years at 5 for a man and 4 for a woman. But what keeps changing is the period of time. Initially it was “in a row,” then “within a few hours.” This latest CDC “report” says “in a sitting” and “over a short period of time,” which conceivably could be almost any length of time. At least the ABC report mentions this inconsistency, noting that the definition of the National Institute on Alcohol Abuse and Alcoholism, says the alcohol must be consumed in “two hours or less.” That works out to a beer every thirty minutes for a woman, and for a man, one every 24 minutes.

But what’s also absent from their definition of binge drinking is weight. The definition of being considered drunk is always expressed as a calculation combining time, the amount of alcohol consumed and the weight of the person drinking it. But binge drinking never takes that into account, apart from dividing up gender, presumably under the premise that men are generally bigger than women. That reality, of course, is not true in every case. And it may be indelicate to say so, but with our obesity issues as a nation, in theory it should be taking us longer to actually get drunk today than it did twenty years ago. But the reality is that a 200-pound man will take longer to get drunk than a 120-pound man. The same amount of alcohol will effect the two differently. So why should both be defined as binge drinkers if one becomes inebriated but the other does not?

And frankly, there’s another elephant in the room that troubles me, but is rarely, if ever, talked about. If you’re an adult and choose to drink 5 beers in a row, are not driving, and are not in any other way putting yourself or others at risk, why shouldn’t you be allowed to go a little crazy once in a while? You are, actually. It’s not illegal. Although neo-prohibitionists might not like it, there’s nothing to stop you from going on a bender if you feel like it. You shouldn’t be made to feel guilty about it. If it gets out of hand, your friends and family will likely step in. If it doesn’t so what? Who are you hurting? But every time these “reports” come out, the implication is that binge drinking is bad no matter what. But not all bingeing is the same, especially as they now define it. The average beer dinner runs to at least five courses (unless Sean Paxton is doing it), meaning that every single person attending such a beer dinner is considered a dangerous “binge drinker” by the CDC and other government agencies. Is that rational or realistic? Of course not. That’s entirely different from a person who bellies up to the bar and downs five shots of rotgut in rapid succession. Yet both are considered equally dangerous and costing society untold millions of dollars. It’s absurd.

Here’s some more of the statistical data, which it should be noted was complied through a telephone poll, from the CDC’s press release:

As reported in this month’s Vital Signs, the CDC found that those who were thought less likely to binge drink actually engage in this behavior more often and consume more drinks when they do. While binge drinking is more common among young adults aged 18–34 years, binge drinkers aged 65 years and older report binge drinking more often—an average of five to six times a month. Similarly, while binge drinking is more common among those with household incomes of $75,000 or more, the largest number of drinks consumed on an occasion is significantly higher among binge drinkers with household incomes less than $25,000—an average of eight to nine drinks per occasion, far beyond the amount thought to induce intoxication.

Adult binge drinking is most common in the Midwest, New England, the District of Columbia, Alaska, and Hawaii. On average, however, the number of drinks consumed when binge drinking is highest in the Midwest and southern Mountain states (Arizona, Nevada, New Mexico, and Utah), and in some states— such as Louisiana, Mississippi, and South Carolina—where binge drinking was less common.

But perhaps where this absurdity becomes most evident is in one of the CDC’s suggestions on how to combat binge drinking, which they list under the heading “what you can do.” Here’s the suggestion: “Follow the U.S. Dietary Guidelines on alcohol consumption; if you choose to drink, do so in moderation — no more than one drink per day for women and no more than two drinks per day for men.” Except those are NOT the most recent USDA dietary guidelines. Not even close. The 2010 guidelines “defines ‘low-risk’ drinking as no more than 14 drinks a week for men and 7 drinks a week for women with no more than 4 drinks on any given day for men and 3 drinks a day for women.” So that’s two government agencies that can’t agree on safe levels of consumption, and one that’s essentially lying about it to bolster their own point of view. The UK has had similar problems with their guidelines, when it was revealed a few years ago that their government just made up the safe guidelines, which then became carved in stone for the next twenty or more years, despite being literally plucked out of thin air.

Before the angry comments start flooding in again, I should point out that I don’t believe that binge drinking is always a good idea, or that people should do it all the time. I’m not arguing in favor of it. However, I do believe one does have the right to go on a binge if they feel like it (and as long as they’re being safe and aren’t doing so frequently enough to alarm those people closest to them). I do believe that how the CDC and others define binge drinking is ludicrous and does more harm than good. By making almost everyone a binge drinker through their ever-narrowing definition, they’re avoiding dealing with the serial binge drinkers who really are hurting themselves, and possibly others around them. This does nothing to combat the people who really need help. All it does is demonize all alcohol drinkers, making us all the same, which even the most jaded neo-prohibitionist has to admit, we’re not. It’s not how many drinks one has, or over what period of time, it comes down to how one handles themselves in that situation. If you’re a safe and responsible drinker, none of the rest of that even matters. Drink by example, that’s my new motto.

UPDATE: One of the biggest problems with studies like this is how uncritically they’re reported by the mainstream media. The most common way a press release like this one is used is by taking it and maybe changing around the words slightly but essentially just regurgitating it wholesale, not doing any follow up or critically examining it, and accepting all of it without question. That’s not what journalism should be, but in many cases that’s what it’s become, sad to say. Case in point is The Daily’s piece on it, Binge There, Done That. On the plus side, there’s this cool infographic they created based on the data from the telephone polls that the CDC conducted. On the negative side, there’s no key to the data, but the report mentions that it’s the “percent of the population” that are binge drinkers.

120112-binge-drinking

Filed Under: Editorial, Politics & Law Tagged With: Anti-Alcohol, Prohibitionists, Statistics

Brewing Up: WSJ Beer Sales Infographic

December 29, 2011 By Jay Brooks

wall-street-journal
The Wall Street Journal, through their WSJ News Graphics twitter feed, posted the following graphic on TwitPic, showing yearly beer sales through November 2011.

wsj-brewing-up-2011

This data is from Nielsen and the Brewers Association. A couple of weeks ago I posted similar numbers, but with data from Symphony IRI, in Beer Sales By Style Through Thanksgiving. According to Nielsen’s data, total beer volume was down 2%, while craft beer was up 16.4%. By dollars, total beer was up just 0.3%, while craft beer was up 17.5%. Nice.

Filed Under: Breweries, News Tagged With: Business, Mainstream Coverage, Statistics

Ownership Of Beer Brands & Varieties 2010

December 18, 2011 By Jay Brooks

bubble-chart
A couple of years ago, shortly after Anat Baron released her film Beer Wars, people kept asking her which big beer companies owned which beer brands. In December 2009, she put together a list of Who owns what? That inspired to me took take a closer look myself, and that produced my own list, The Bigs Brewers’ Brands. At the time, I had hoped to keep it current, but that’s proved too time-consuming a task and it hasn’t been updated since December 4, 2009.

Now Philip H. Howard, an assistant professor at Michigan State University, in the Department of Community, Agriculture, Recreation and Resource Studies, has created an infographic on the Concentration in the US Beer Industry. The bubble chart seeks to show the major companies selling beer in the U.S. — domestic and imports — and also uses different lines to show arrangements of distribution and partial ownership, where applicable.

BeerOwnership
You can see more detail on the full size image, which can be seen here. You can also zoom in using Zoom.It. Howards also notes “that the graphic above focuses on the top 13 firms, and excludes varieties of malt liquor and non-alcoholic beers.”

His write-up also includes the following:

AB InBev owns, co-owns or distributes more than 36 brands, for example, while MillerCoors controls at least 24 more. MillerCoors also brews Metropoulos & Company’s products under contract (thus the company that controls Pabst and 21 other brands is a “virtual” beer company).

Increasing Concentration after World War II

In 1959 the 10th largest brewery in the country (Pabst) acquired the 18th largest brewery (Blatz), resulting in a combined national market share of 4.5%. Seven years later the US Supreme Court reversed the merger, noting that:

If not stopped, this decline in the number of separate competitors and this rise in the share of the market controlled by the larger beer manufacturers are bound to lead to greater and greater concentration of the beer industry into fewer and fewer hands. [Justice Hugo Black in U.S. v. PABST BREWING CO., 384 U.S. 546 (1966)].

Today, just two firms control more than three-quarters of all sales.
market-share-2010

Howard also quotes Stephen G. Hannaford, writing in 2007, in Market Domination!: The Impact of Industry Consolidation on Competition, Innovation and Consumer Choice. “The beer industry is not only dominated by two firms, it is dominated by a small number of varieties — just six account for more than half of all sales. The result is an ‘oligopoly within the oligopoly'” Howard demonstrates this relationship with another chart.

beershare-2010
You can also explore this one better by using Zoom.It.

Filed Under: Beers, Breweries, Just For Fun Tagged With: Big Brewers, Business, Statistics

Breweries Per Capita By State 2010

December 17, 2011 By Jay Brooks

maps-usa
I recently stumbled upon this nice infographic showing Breweries Per Capita By State 2010 based on data compiled by the Brooklyn Growler. It was created by an assistant professor at Michigan State University, Phillip H. Howard, with help from a Ginger Ogilvie. The size of the circles neatly shows the relative number of breweries in each state, relative to its size, though knowing how populous each state is helps to make it more understandable.

breweries-per-capita-by-state-2010
You can see the map full size here.

Filed Under: Breweries, Just For Fun Tagged With: Geography, Statistics

Beer Sales By Style Through Thanksgiving

December 11, 2011 By Jay Brooks

sales-chart-up
MC Basset, publishers of the Beer Bible — better known by its official title, “The Essential Reference of Domestic Brewers and Their Bottled Brands” — in their monthly e-mail blast, Style Trends, “provided a snapshot of (YTD) beer sales by beer style.” The data they use was compiled by the Symphony IRI Group (IRI), using “a data set that includes 15,000+ US grocery retailers.” The two charts below graph beer sales for calendar year 2011, through November 27th.

It’s also important to remember that by “beer styles,” they don’t mean styles in the ordinary sense used by homebrewers and judges in beer competitions, where the goal is to categorize beers of like characteristics together for ease of comparison. As IRI uses the term, they’re more of a loose arrangement of how they’re sold, since that’s their main focus. They also define what is “craft” beer differently than, say, the Brewers Association does, again because their goals are different. In their world, there are less “styles” than we’re generally used to, but what is “craft” is more loosely defined, allowing almost any beer that’s not a mainstream beer to be included.

In the first chart, it shows sales through Thanksgiving of the Top 15 craft styles based on dollar sales. There’s actually very little that’s surprising in this chart, as the category “seasonals” has been the top category for some time now, and IPAs, in second, is likewise how things have been for some time now. It basically shows that current trends are continuing as they have been lately.

craft-$sales-11-11-27

The second chart, however, I find more interesting. It’s showing the same fifteen categories, but by how their sales have changed, by percentage, over the same period of time from last year. In essence, this chart shows which kinds of beers are doing better this year than they did last year.

craft-$change-11-11-27

The second best recorded change, India Pale Ales — at just over 40% — has been trending up for a few years now, and hoppy beers continue to sell well. But what came in at number one is more surprising. Belgian Ales (really Belgian-style ales) are up around 50% over last year. Sure, it’s on a smaller base, but it’s still great to see more complex beers registering such a big increase. Undoubtedly, part of the reason for this is probably due to more outlets beginning to recognize customer demand and adding these beers to their set; but that, too, is a welcome development.

The other surprise is “stouts,” which are also up around 40% over 2010. And five of the beer styles are up over 10%, including “brown beer,” “pale lagers,” “porter,” “seasonals,” and “strong ales.” Only one style is down over last year, and that’s “craft light beer.” I presume that’s mostly Sam Adams Light, though there are a few others, such as Genny Light, Point Honey Light, Shiner Light and Yuengling Light that probably are included in that category.

Of all fifteen categories, all but three of them show fairly healthy growth. In addition to “craft light beer’s” slide, both “amber lager” and “wheat” grew only very slightly in 2011. Every other category grew by at least 5 or more percent from 2010 to 2011. Not bad in a recession.

Filed Under: Beers, Breweries, Editorial, News Tagged With: Business, Statistics

Top 8 Beer Sales Days

November 26, 2011 By Jay Brooks

sales-chart-up
This two-year old SlashFood article showed up in my Paper.li today, retweeted by a brewery I follow. The article, Super Bowl Sunday — The 8th Biggest Beer Day of the Year? questions the list of the top eight “Holidays/Events for Beer.” The list was complied by Nielsen, and as he points out is “combined beer sales from all U.S. outlets (including food, liquor, convenience and drug).” He’s initially is skeptical about why sales for the week following the holiday/event are also tracked, but eventually figured out that’s just how the weeks are tracked. If you want to include a week in which the holiday falls on a Sunday, you have to include the week prior and the week of to get all the relevant sales data. Author Mike Pomranz drew many of his conclusions from his correspondence with Nielsen executives, who naturally have a healthy bias in favor of their own data. As a result, Pomranz may not fully appreciate two additional tidbits about those statistics.

First, Nielsen’s data is almost entirely chain store sales. The big supermarket chains, drug stores, big box stores, convenience stores. As such, it’s a big slice of the pie, but it’s still nowhere near the whole pie. Missing from its numbers are thousands of small independent outlets that sell beer. It works because the sample is the same from period to period and so comparisons and trends can be confidently teased out of the data, and it’s certainly useful, but it doesn’t tell the whole story. What most people outside the industry forget, IMHO, is that it isn’t intended to be all-inclusive. It’s purpose is to identify sales trends and big picture activity. When I was the beer buyer at BevMo, I’d see an endless parade of Nielsen data from various breweries, and each would tell a different story, simply because of the way the information was massaged. There’s so much data that it can be drilled down in endless ways, with each business doing it in a way that was most favorable to their purposes, to show their sales in the best possible light. So it should be taken with a grain of salt. It’s most useful when comparing the same set of data over different periods of time; weeks, months, quarters, years, etc.

beersales

But it tends to break down when comparing different time periods, as in this list, because there are so many more factors that the raw numbers can’t capture. Pomranz certainly gives seasonality its due, concluding that “[i]f you were to normalize sales to account for weekly seasonal changes in overall beer sales, the often beer-centric celebration of the Super Bowl would most likely move significantly up the list.” That’s because climate — the weather — plays a HUGE part in beer sales that can’t be overstated. When the thermometer ticks up, beer sales go up. When it’s time to put on a sweater, beer sales plummet. It’s always been very seasonal that way. But even my old bosses at BevMo failed to recognize its importance and would routinely blame me for poor beer sales (or at least not hitting sales goals) when forces out of my control would hurt the amount of beer people bought. I even had one person tell me I was essentially not allowed to blame the weather, which is a bit like saying you can’t explain getting wet by pointing to the rain.

So not surprisingly, the top four holidays all take place during warm months of the year. And while you don’t normally associate Father’s Day with big beer-soaked picnics, just the fact that it’s in June may account for increased sales. Frankly, Easter is likewise one of those holidays that few people have been able to tie in with beer, but as it usually comes in the spring, it could also be a coincidence of the season.

Second, the Nielsen data is for “Case Sales.” In other words, not kegs. And a lot of holiday or event parties include kegs. For example, every year I was with BevMo our number one weekend for keg sales was Halloween. But in the Nielsen data, it doesn’t even crack the top eight. To me, that suggests another one of the limitations of their list. It’s just common sense. You can’t tell me more people drink beer for Easter than Halloween. Again, that’s because the data is imperfect and not comprehensive. It’s just a snapshot of one particular portion of the beer market.

And in fact, one year later, in 2010, the very same Nielsen chart for the subsequent year has the Super Bowl now in 7th place, with Halloween in 6th, and Easter and Father’s Day no longer registering.
nielsen-top-beer-holidays-jan-2010
So while I think we can mostly agree on which holidays or events are the biggest in terms of beer drinking, even if the order they’ll fall in will vary slightly, it’s best not to rely too heavily on incomplete data that’s not intended to be all-encompassing of the total beer market in America.

Filed Under: Beers, Editorial, Events, News Tagged With: Business, Football, Holidays, Sports, Statistics, Super Bowl

Declines Of The British Pub Slowing?

November 20, 2011 By Jay Brooks

pub-sign
In September, the British Beer & Pub Association released information regarding pub closures in the UK.

Back in the 1970s more than 90% of all beer consumed in Britain was bought from the “on trade” — pubs and clubs.

According to the British Beer & Pub Association this ratio had fallen to 51% from pubs and 49% from supermarkets at the end of last year. “It will cross over in the near future,” said a spokesman, possibly as soon as this Christmas.

This would be a watershed moment for Britain’s beer industry, a culmination of long-standing change in consumers’ drinking habits as well as confirmation that the recession has caused people to stay at home more.

The figure came as a report from the GMB union highlighted how the high price of beer has caused the destruction of thousands of neighborhood pubs, in turn damaging many working class communities. It said that local pubs, many of which had survived the Blitz and the great depression of the 1930s, were now being destroyed by the recession.

Pub closures hit a record rate of 53 a week at the height of the recession. Last year, 26 a week closed their doors, leaving just 52,500 pubs in Britain, nearly half of the level at its peak before the World War II.

The Beer & Pub Association blamed competition from the supermarkets, which often sell beer as a “loss leader” to drive customers into their stores, and above-inflation increases to beer duty. The GMB blamed large pub companies putting up their prices because they were struggling with too many debts.

Last week, they released a new statement, Sticking to the facts on pub closure numbers, which said, in part:

The BBPA has moved to set the record straight over conflicting analysis in recent days of UK pub closure figures. It is absolutely clear from CGA data, says the BBPA, that free trade pubs have been closing at a much faster rate that tenanted and leased pubs in recent years. The BBPA has published its full analysis of the data on its website, today available from the link below.

From January 2009 to June this year, CGA figures show 3,444 free trade pubs closed, compared with 2,239 tenanted and leased pubs over the same period. As the free trade sector has considerably fewer pubs, their closure rate over the period was almost double that of the tenanted and leased sector, at 16 per cent, as compared with 8 per cent. Taking new openings into account, there was a 9 per cent net reduction in free houses, compared with a 6 per cent reduction in tenanted and leased.

Free trade closures are higher, despite the considerable numbers of pubs being sold into the free trade from the tenanted sector. The reason that there are more free-trade pubs now than there were at the start of 2009 is that companies have sold tenanted/leased pubs to private owners, where this has been deemed appropriate.

“Pub closures are caused by a huge range of issues — the greatest of which we can influence are undoubtedly punitive rates of taxation and the high cost of regulation. And though there is still some way to go to halt the decline, we should all welcome that the latest figures show that the net closure rate has fallen significantly.”

Still, net closures are 14 per week. That’s two a day! But really, it’s 28 pubs closing each week or four a day, which is even more alarming. I’ve been told by Brit friends who know more about this than I do that it’s the bad pubs that are closing, but I have a hard time believing that’s all it is. With that many closing, there must be some good ones, or at least just average ones, that can’t survive as well.

CGA-2011-1

Overall closures are declining since their all-time high (or low) in 2008, as are openings as well, so you can see why there is some reason for optimism. When things are going poorly, you tend to focus on whatever positives you can. Everyone who was involved in craft beer in the mid-1990s will know what I mean. But I’d still be more pleased if the British pub was to regain its footing by opening more pubs than are closing.

CGA-2011-2

Filed Under: Beers, Editorial, News, Politics & Law Tagged With: Pubs, Statistics, UK

« Previous Page
Next Page »

Find Something

Northern California Breweries

Please consider purchasing my latest book, California Breweries North, available from Amazon, or ask for it at your local bookstore.

Recent Comments

  • Ernie Dewing on Historic Beer Birthday: Charles William Bergner 
  • Steve 'Pudgy' De Rose on Historic Beer Birthday: Jacob Schmidt
  • Jay Brooks on Beer Birthday: Bill Owens
  • Steve 'Pudgy' De Rose on Beer Birthday: Charles Finkel
  • Steve 'Pudgy' De Rose on Beer Birthday: Bill Owens

Recent Posts

  • Beer In Ads #5204: Oh Brother! Griesedieck Bros. Genuine Premium Bock Beer Is Here! February 15, 2026
  • Historic Beer Birthday: Emil Resch February 15, 2026
  • Historic Beer Birthday: Philip Zang February 15, 2026
  • Beer In Ads #5203: Robert Portner’s Bock Beer February 15, 2026
  • Historic Beer Birthday: August Schell February 15, 2026

BBB Archives

Feedback

Head Quarter
This site is hosted and maintained by H25Q.dev. Any questions or comments for the webmaster can be directed here.