Brookston Beer Bulletin

Jay R. Brooks on Beer

  • Home
  • About
  • Editorial
  • Birthdays
  • Art & Beer

Socialize

  • Dribbble
  • Email
  • Facebook
  • Flickr
  • GitHub
  • Instagram
  • LinkedIn
  • Pinterest
  • RSS
  • Twitter
  • YouTube

Powered by Genesis

Calories In Beer: Can We Please Stop, Part 2

October 21, 2010 By Jay Brooks

diet-beer
Here’s part two of some nonsense that began last week, with Calories In Beer: Can We Please Stop?, in which I analyzed a very weird list where the Daily Beast created what they called the unhealthiest beers, under the title the 50 Most Fattening Beers.

Using an impenetrable combination of calories, carbohydrates and alcohol that ultimately showed no patterns, it ended up just being a list that made no sense, and provided no real guidelines that could be considered useful. Here’s what I said last week.

So the reality is that there’s not that much difference between most beers in terms of calories, and carbs too for that matter. Since drinking in moderation is the goal, 2-4 beers per day, then you should never choose a beer the beer with the least flavor. And that’s pretty easy to do since most are within a fairly narrow range by the numbers. It’s never enough to sacrifice what the beer tastes like for some meaningless number, be it carbohydrates or calories. And perhaps most importantly, you should never take advice from someone telling you what not to drink, not even me. Decide for yourself what to drink — not what not to drink — and let flavor be your guide.

This week, the Daily Beast has released a new list, this time The 50 Healthiest Beers, Ranked by Carbs and Calories.

Unfortunately they start with this premise. “How can you drink beer but avoid the belly?” Except that the beer belly is a myth and recent studies have essentially completely discredited it.

They’re also behind the times when they say “drink more than two per day, and the [health] benefits disappear.” The latest dietary guidelines from the FDA now recommends that a man can remain healthy if he consumes four drinks a day, so long as he doesn’t exceed the weekly maximum recommendation of 14 drinks. And another study recently found drinking six beers a day could lead to a healthier heart.

Instead, they focused again on “alcoholic punch” as a determining factor, which is unfortunate. This is what they calculate as “the best beers for your buzz.” Here’s the nuts and bolts of how they compiled the list:

To ensure a wide range of beers were considered, we looked at the offerings of the largest 15 domestic breweries and the largest five international breweries based on import volume to the U.S. Our final list was whittled further so that no more than three variations of brews from a single brand of beer were included in the top 50. We used data from the manufacturers when available, using reliable third-party databases if necessary.

But perhaps the lowest point of the exercise comes when they claim their list proves “that beer lovers don’t necessarily have to sacrifice taste for health.” The list includes 24 low-calorie light beers (48%), 8 ice beers (16%), 5 adjunct lagers (10%) and 10 malt liquors (20%). That’s 46 (or 92%) [1 beer is both an ice beer and a light beer] in styles I wouldn’t drink with a ten-foot straw. So much for diversity. The remaining four beers include a European lager, a blonde ale, a stout and an IPA. But as with the last list, there doesn’t seem to be any discernible pattern. There’s two, maybe three, beers on the list that I’d willingly order. Now maybe that’s just my own pickiness, what do you think? How many of them are beers you’d drink, regardless of their supposed healthy nature?

Like the last list, I don’t find the criteria here very good for finding good beers to drink. All the number crunching avoids the more important intangibles like aroma, taste and flavor. That’s the best reason to choose one beer over another. That, and other intangible factors like context, food, weather, etc. In the end, if the beers on this list are really the healthy beers, I don’t don’t want to be healthy. Better to actually enjoy what I’m drinking.

The Beast’s 50 Healthiest Beers

KEY: Brewery Beer: calories per 12 oz. / carbohydrates / a.b.v.

  1. Pittsburgh Brewing I.C. Light: 95 / 2.8 / 4.15%
  2. Michelob Ultra: 95 / 2.6 / 4.1%
  3. Anheuser-Busch Natural Light: 95 / 3.2 / 4.2%
  4. Anheuser-Busch Budweiser Select: 99 / 3.1 / 4.3%
  5. MillerCoors Miller Lite: 96 / 3.2 / 4.2%
  6. Anheuser-Busch Select 55: 55 / 1.9 / 2.4%
  7. Anheuser-Busch Busch Light: 95 / 3.2 / 4.1%
  8. MillerCoors MGD 64: 64 / 2.4 / 2.8%
  9. Grupo Modelo Modelo Especial: 145 / 4 / 6%
  10. MillerCoors Milwaukee’s Best Light: 98 / 3.5 / 4.2%
  11. Michelob ULTRA Amber: 95 / 3.2 / 4%
  12. MillerCoors Miller Chill: 100 / 4 / 4.2%
  13. MillerCoors Keystone Ice: 142 / 5.9 / 5.9%
  14. Grupo Modelo Corona Light: 109 / 5 / 4.5%
  15. MillerCoors Coors Light: 102 / 5 / 4.2%
  16. Anheuser-Busch Bud Ice: 123 / 8.9 / 5.5%
  17. MillerCoors Milwaukee’s Best Ice: 144 / 7.3 / 5.9%
  18. Michelob ULTRA Lime Cactus: 95 / 5.5 / 4%
  19. MillerCoors Icehouse Light: 123 / 6.6 / 5%
  20. MillerCoors Southpaw Light: 123 / 6.6 / 5%
  21. MillerCoors Keystone Light: 104 / 5 / 4.1%
  22. Anheuser-Busch Bud Light: 110 / 6.6 / 4.5%
  23. MillerCoors Keystone Premium: 111 / 5.8 / 4.4%
  24. Guinness Foreign Extra Stout: 176 / 14 / 7.5%
  25. Leinenkugel Light: 155 / 15 / 4.8%
  26. Anheuser-Busch Natural Ice: 157 / 16 / 4.9%
  27. Yuengling Light: 98 / 6.6 / 3.8%
  28. MillerCoors Miller High Life Light: 110 / 7 / 4.2%
  29. Grolsch Light Lager: 97 / 5.7 / 3.6%
  30. MillerCoors Molson XXX: 201 / 10.9 / 7.3%
  31. MillerCoors Icehouse 5.0: 132 / 8.7 / 5%
  32. MillerCoors Steel Six: 160 / 11 / 6%
  33. MillerCoors Olde English 800 7.5%: 202 / 13.4 / 7.5%
  34. MillerCoors Icehouse 5.5: 149 / 9.8 / 5.5%
  35. MillerCoors Olde English 800 5.9%: 160 / 10.5 / 5.9%
  36. MillerCoors Olde English High Gravity 800: 220 / 14.6 / 8%
  37. MillerCoors Mickey’s Ice: 157 / 11.8 / 5.8%
  38. MillerCoors Steel Reserve High Gravity: 222 / 16 / 8.1%
  39. MillerCoors Steel Reserve Triple Export 8.10%: 222 / 16 / 8.1%
  40. MillerCoors Molson Golden: 133 / 10.9 / 5%
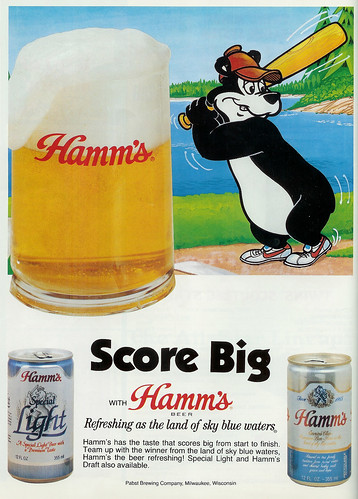
  41. MillerCoors Hamm’s Special Light: 110 / 7.3 / 3.9%
  42. Heineken Light: 99 / 6.8 / 3.5%
  43. MillerCoors Magnum Malt Liquor: 157 / 11.2 / 5.6%
  44. MillerCoors Mickey’s: 157 / 11.2 / 5.6%
  45. MillerCoors Tyskie: 153 / 10.6 / 5.4%
  46. MillerCoors Molson Canadian: 136 / 11.1 / 5%
  47. Yuengling Light Lager: 96 / 8.5 / 3.6%
  48. Redhook Long Hammer IPA: 188 / 12.66 / 6.5%
  49. Genesee Ice: 156 / 14.5 / 5.9%
  50. Beck’s St. Pauli Girl Lager : 148 / 8.7 / 4.9%

Filed Under: Beers, Editorial Tagged With: Health & Beer

Yuengling Talks To The Wall Street Journal

October 21, 2010 By Jay Brooks

yuengling-eagle
With the announcement that Yuengling Brewery is buying their fourth brewery to continue to expand their market, the Wall Street Journal today has a nice overview of the company’s plans for the future. Check out After 181 Years, Local Beer Stops Playing Hard to Get.

dick-yuengling
Dick Yuengling (Photo by Scott Lewis)

Filed Under: Breweries, News Tagged With: Interview, Mainstream Coverage, Pennsylvania

Beer In Ads #220: The Goodness of Malt (& Baseball)

October 20, 2010 By Jay Brooks

ad-billboard
Wednesday’s ad is the second baseball-themed one, which I’ll be continuing through the World Series. The ad is from 1958 and is by the now defunct trade organization for brewer’s malt, the Barley and Malt Institute. It features a number of men enjoying both beer and baseball. The text is great, too. “The goodness of Malt yours when you say , “Let’s make it beer.” It looks like beer at the ballpark in 1958 may have been $1. The man in the foreground is holding two beers, and the hand on the right appears to have just accepted two dollar bills. That, or it’s even cheaper and he just bought a round for the row.

barley-and-malt-1958-baseball

Filed Under: Art & Beer, Beers Tagged With: Advertising, Baseball, History, Sports

Under the Influence of Recession

October 20, 2010 By Jay Brooks

california
The California Board of Equalization — our taxing agency — yesterday sent out a press release with the results of a study they did on drinking trends in the state based on the collection of excise taxes. The release, Under the Influence of Recession: BOE Answers the Question, “Do People Drink More During an Economic Downturn?” is available as a pdf from the BOE’s newsroom page.

Below is the press release, which reports the overall findings:

There are no consistent patterns in alcohol consumption or spending on alcohol during recessions, a report released today by Board of Equalization (BOE) Chairwoman Betty T. Yee concludes.

The November 2010 edition of the BOE’s Economic Perspective newsletter looks at alcohol consumption data during the recessions of 1970, 1973, 1980, 1981, 1990, 2001 and 2008. The Economic Perspective is a quarterly publication produced by the BOE that looks at economic factors of interest or that influence California economic activity. The November edition looks exclusively at the issue of alcohol consumption during the seven recessions of the last 40 years.

“Economic data compiled by the Board of Equalization contains a wealth of information for estimating revenue impacts and other analyses that serve the agency’s tax administration mission,” said Chairwoman Yee. “In this case, the figures do not indicate any generalized patterns of behavioral change in alcohol use during bad economic times.”

The BOE report notes several ways consumers would be expected to react during recessions: First, total alcohol consumption per capita may fall during the recession, as consumers would have less income to spend on alcohol. Second, consumers may substitute less expensive brands of alcohol for more expensive brands or less expensive ways to consume alcohol for more expensive ways, such as more off-premises consumption during recessions, as opposed to in bars and restaurants. Third, consumers may change the kind of alcohol they drink, for example switching from distilled spirits to less expensive alternatives such as beer. The fourth response, based on psychology more than economics, would be that consumers “drink away their sorrows,” and increase alcohol consumption during recessions. The data show examples of all four kinds of responses during recessions. The most consistent response, occurring in four of the seven recessions studied, was lower growth in on-premises alcohol consumption.

The November Economic Perspective also notes that in terms of national spending patterns on alcohol, prior to the 2008-09 recession total U.S. spending rose 2.4 percent. In contrast, during the 2008-09 recession, U.S. spending on alcohol declined by 1.7 percent.

The Economic Perspective newsletter also notes:

  • Alcohol consumption nationally is at a 25-year high, based on a Gallup survey released in the summer of 2010, with 67 percent of Americans drinking alcohol.
  • Federal Health and Human Services data show a low of 1.96 gallons ethanol consumption per capita in 1954 (a recession year) and a high of 2.76 gallons in both 1980 and 1981 (both of which were recession years).
  • The data show that California alcohol consumption has generally followed national trends in the last 20 years. California per capita consumption, like the U. S., reached a low point in 1998, then started gradually trending upward.

The report points out that historical data show that when confronted with a recession, people who drink alcohol have responded in a variety of ways.

Various Responses Represented in Recessions

The data show examples of all four kinds of responses during recessions. The first consumer response, less growth in total alcohol spending, occurred in 1973, 2001, and 2008. Chart 3 shows these changes in total alcohol spending for each recession. The second kind of response, lower growth in on-premises alcohol consumption, occurred in the recessions that started in 1973, 1980, 1981, and 2008. This appears to be the most consistent response, happening in four of the seven recessions.The third response was seen in both of the 1970s recessions. Beer consumption went up in the recessions of the 1970s, while distilled spirits consumption went down. This kind of response has not happened since the 1970s. And the fourth response, significantly higher total alcohol spending during a recession, happened in 1970 and 1990.

boe-2010-2

And here’s some interesting tidbits from the Economic Perspective newsletter:

Average total U.S. ethanol consumption per capita is tabulated by decade in [the chart below] to track long-term trends. As shown in the chart, average ethanol consumption per capita for the first nine years of the first decade of 2000 was similar to that of both the 1960s and the 1990s. The recent decades with the highest consumption were the 1970s and the 1980s.

boe-2010-1

And here’s some more from the newsletter on alcohol and the economy.

U. S. Alcohol Drinking rate at 25-Year High

A Gallup survey released in the summer of 2010 indicated that 67 percent of Americans drink alcohol, the highest percentage recorded since 1985.1 Is there some kind of statistical relationship between alcohol consumption and economic growth? Do people drink more during recessions and associated periods of high unemployment rates?

Do We Drink More During Recessions?

To answer this question, this article reviews long term and short term trends in alcohol consumption and analyzes changes before and during the recessions we have had since World War II.
According to Gallup:Despite some yearly fluctuations, the percentage of Americans who say they drink alcohol has been remarkably stable over Gallup’s 71 years of tracking it. The high point for drinking came in 1976-1978, when 71 percent said they drank alcohol. The low of 55 percent was recorded in 1958. When Gallup first asked Americans about drinking, in the waning days of the Great Depression in 1939, 58 percent of adults said they were drinkers.

Gallup reports also note that the percentage of Americans who say they drink alcohol has been in the low 60s fairly consistently since 1947.

Gallup Data Show Alcohol Use Unrelated to Recessions

Based on these data, it would appear that prior to 2010 there was little, if any relationship between the percentage of people drinking and economic conditions. The economy was not in a recession during the 1976-1978 period, when the highest percentage of adults defined themselves as alcohol drinkers (71 percent). In fact, the economy was growing rapidly, with real gross domestic product (GDP) increasing an average of 5.2 percent per year during this three-year period. This is well above the 2.9 percent average annual growth rate experienced by the U.S. economy since 1945. The economy was in a recession from August 1957 through April 1958, about the time of the lowest percentage of adult drinking in Gallup’s records (55 percent).2 If anything, these extreme points in the Gallup poll results seem to indicate that people drink more when the economy does

Other Measures of Alcohol Consumption

Polls such as those done by the Gallup Group measure how prevalent drinking is. Other measures indicate how much alcohol is consumed. These include ethanol (pure alcohol) content, gallons of liquid by type of product, and spending in dollars.

Health and Human Services Alcohol Surveillance Reports

The U.S. Department of Health and Human Services (HHS) periodically does surveillance reports of state and national alcohol consumption in terms of gallons of ethanol content of beer, wine, and distilled spirits per capita for those over age 14. Sources of data include state government revenue agencies and various industry sources. The most recent HHS report has these annual data from 1934 through 2008.3 The data show no obvious correlations with recessions. For example, in 2001 (the most recent recession covered by these data) total U.S. ethanol consumption from beer, wine, and distilled spirits was 2.18 gallons per capita,

Alcohol Consumption Rising Since 1998

The HHS data show that total U.S. ethanol consumption reached its most recent low point in 1998, at 2.14 gallons per capita. It has been slowly trending upward since then, reaching 2.32 gallons per capita in 2008. As shown in Chart 1, wine and distilled spirits were responsible for the increase in U.S. per capita consumption from 1998 to 2008.

Lowest and Highest Alcohol Consumption

The lowest U.S. total ethanol consumption since the end of World War II was 1.96 gallons per capita in 1954 (a recession year, with a recession running from July 1953 through May 1954). The highest consumption was 2.76 gallons per capita in both 1980 and 1981 (both recession years, each with six-month periods of recessions).

On additional interesting findings is that during a recession, they did note that people tend to go out less frequently, meaning sales of alcohol at restaurants and bars decline, but based on the uptick in retail purchases of alcohol for home consumption it’s essentially a wash. But that means, as we’ve seen brewpubs and restaurants struggle a bit while package craft and regional breweries have had solid growth.

The BOE study concludes that “there appear to be no consistent patterns in alcohol consumption or spending during recessions. Recessions are all different; some last longer than average, some are associated with more than average job losses. Alcohol consumption responses during recessions are also different, and not very predictable. The historical data show that when confronted with a recession, people who drink alcohol have responded in a variety of ways.”

Filed Under: Beers, Editorial, News, Politics & Law Tagged With: California, Press Release, Taxes

Beer In Ads #219: Score Big With Hamm’s

October 19, 2010 By Jay Brooks

ad-billboard
Tuesday’s ad is the first baseball-themed one, which will continue through the World Series. It’s for Hamm’s Beer, and is a newer ad, at least from the period of time when Pabst owned the brand, before selling it to Miller — 1983-99. But it’s a great use of the Hamm’s Bear playing baseball.

Hamms-baseball

Filed Under: Art & Beer, Beers Tagged With: Advertising, History, Sports

Busch Jumps On Cold Indicator Label Bandwagon

October 19, 2010 By Jay Brooks

busch-light
For many years, Coors has been the brewery obsessed with cold. But that may be changing, as Anheuser-Busch InBev is debuting their own cold-activated labels on bottles of Busch Light. ABI is calling their version of the cold-activated label an “ice-cold easy indicator.”

ice-cold-easy

According to an article today by AdAge:

An “ice-cold easy indicator” thermometer turns blue when the temperature is just right, an Anheuser-Busch spokesman told Ad Age, noting that the special packaging has already hit some stores. The innovation resembles what competitor MillerCoors has done with its Coors Light bottles, which feature mountains that turn blue “when it’s as cold as the Rockies.”

“Thermochromatic ink on beer [bottles]? I’ve heard that’s been done before,” said a MillerCoors spokesman.

Coors Light is one of the few big beer brands whose sales are growing, albeit slowly, and the cold-activated bottles are a focal point of its advertising. It is unclear if A-B plans a big promotional push for its new Busch Light bottles. The sub-premium brand traditionally gets less advertising attention than Budweiser and Bud Light.

As far as I’m concerned, the only good reason to make sure either of these beers are cold enough to turn the label blue is so they’re cold enough to numb your taste buds so you can no longer taste them. But it’s that reliance on marketing gimmicks instead of making products people actually want that makes this such a bad idea to me.

busch-light-new-btl

Filed Under: Beers, Editorial, News Tagged With: Big Brewers, Marketing, Science

Not OK: Oklahoma Considering Beer Tax Hike To Punish Drinkers

October 19, 2010 By Jay Brooks

oklahoma
Oklahoma joins the ranks of states currently considering raising the tax on beer and other alcohol due to budget shortfalls, in effect punishing alcohol companies and the vast majority of people who enjoy drinking their products responsibly. According to the Oklahoman, the heads of three state health agencies, Health Commissioner Terry Cline, Mental Health Commissioner Terri White and Howard Hendrick, director of the Department of Human Services, “urged state lawmakers to raise the alcohol tax to help address a 2012 fiscal year budget deficit that could be as large as $800 million.” This is the same nonsense going around in other states whereby lawmakers go after a convenient target, often with the help of anti-alcohol groups, that they know play well to constituents raised on temperance propaganda that demonizes alcohol as a sin. But essentially the tax hikes aimed at alcohol punish both the companies that make the products and the majority of consumers who drink them responsibly and in moderation, while doing nothing whatsoever to address the root causes of the tiny minority that do abuse alcohol and drugs. They’re not remotely fair.

I’m as sorry as the next citizen that states can’t meet their budgets, but alcohol didn’t cause the problem and shouldn’t be called upon to fix it, either. We should have learned our lesson when this was first tried, during the Civil War, but we keep looking to lifestyles that some people find morally objectionable and trying to legislate that morality to punish people for their choices that differ from the self-righteous. But the budget problems Oklahoma, and many other states, are facing were not caused by alcohol. The specious “charge for harm” notion that the Marin Institute, and other anti-alcohol groups, are pushing is a flawed idea that argues that everybody who makes and drinks alcohol has to pay for any problems caused by a tiny minority that abuses it. But it continues to gain traction because if you beat a drum long enough, and never hear another beat, people start to believe the music is good.

For example “Howard Hendrick, director of the [Oklahoma] Department of Human Services, also said the state should look at increasing the alcohol tax to help pay for treatment and medical costs associated with the use of the product.” But the “medical costs” are not “associated with the use of the product,” if anything, they’re associated with its misuse, a very different thing. The assumption is that everybody that drinks alcohol is a burden on the nation’s healthcare system, but that is not only false, but backwards. The vast majority of people who drink, and who do so responsibly and in moderation, are actually living a healthier lifestyle and are less of a burden on healthcare as a direct result of their good drinking behavior. Such people will most likely live longer than abstainers or binge drinkers.

Hendrick concludes with this tortured bit of logic:

“We’re not saying you can’t drink, we’re not going to prohibition we’re just asking you to pay your share of the cost,” Hendrick said. “We’re just trying to deter people from behaving irresponsibly with alcohol.”

What nonsense. If I, and in fact most people, drink responsibly then we’re not costing society one penny more than any other person. If anything, by our moderation, we’re burdening the healthcare system less and are in fact saving money for the system. We have no “share of the cost” to pay. Raising the cost of alcohol through higher taxes in order “to deter people from behaving irresponsibly” is incredibly insulting to the majority who do not behave irresponsibly. But such logic is pervasive and does nothing to actually stop alcohol abuse. Like any addiction, an addict will find a way to get his preferred addiction by any means necessary.

The only thing that such measures accomplish is that they damage the economy, and place a greater burden on poor people, since alcohol taxes are very regressive. The higher taxes punish primarily law-abiding responsible citizens by raising the price of alcohol even though they’ve done absolutely nothing to deserve such a punishment and in fact have done just the opposite. Lawmakers just can’t let any good deed go unpunished, especially when they’re trying to fix their own mistakes without acknowledging their own culpability or making themselves look bad. Better to blame everything on alcohol. And why not, demonizing alcohol has worked quite well for over a century. There’s no reason to let the facts get in the way of a good story now.

Filed Under: Beers, Editorial, News, Politics & Law Tagged With: Midwest, Oklahoma, Prohibitionists

The Case Of The IPA: A Mystery Told In 12 Bottles

October 19, 2010 By Jay Brooks

buzzards-bay
Buzzards Bay Brewing in Westport, Massachusetts, may have abandoned their flagship lager, but their creativity is still alive and brewing. Their latest idea is all over the labels of their new India Pale Ale, it’s a serialized mystery story told over twelve different labels, with each one containing a portion of the story. Here’s how they tell it at their new website, Just Beer:

Just beer is proud to reveal a unique collaboration between brewer and author.

“The Case of the IPA” is a hard-boiled detective farce printed chapter by chapter on 12 bottles of a newly released India Pale Ale. Each 22 ounce bottle not only has 22 ounces of brilliantly deduced IPA, but also 1 of the 12 chapters of the story. Each case has 12 bottles, which makes for the entire tale told in a case. And so, the Case of the IPA is indeed a case of the IPA.

Brewer Harry Smith proposed the idea to author Paul Goodchild and they quickly agreed on a format: a noir-ish detective serial. Smith brewed up a batch of hoppy craft brew whilst Goodchild penned the story. It’s a mystery of zany brewers and their intrigues; sure to tickle the ribs and please the belly of any fan of craft beer.

As this is a bottle by bottle mystery, Just Beer reminds all to “please read responsibly.”

You can also read all about it at the Cape Cod Times. And here’s Chapter 1 to whet your appetite and your thirst for more:

Case-of-IPA-Ch-1

Filed Under: Beers, Just For Fun, News Tagged With: Literature, Massachusetts

Customer Satisfaction With Beer Continues To Fall

October 19, 2010 By Jay Brooks

acsi
The American Customer Satisfaction Index (ACSI) today released their latest findings for a variety of products, and beer again continued to drop. I should point out, however, that the ACSI tracks only the big brands. As far as I can tell, they do not track any craft brewers. Since they refer to “Corona, Heineken, and Samuel Adams” all as “smaller brands,” I feel confident that very few, if any, craft breweries are on their radar. As a result, these findings — while interesting — are only relevant for the big picture and don’t reflect the continuing gains and positive growth in the craft sector.

From the press release:

Beverages: Anheuser-Busch Tanks
Beer drinker satisfaction falls from its all-time high in 2009 by 2.4% to 82, driven by a sharp decline for Anheuser-Busch products. Last year, shortly after its acquisition by Belgian InBev, Anheuser-Busch recorded its best ACSI score ever and captured the industry lead. Now that gain evaporates, as the company drops 4% to an ACSI score of 82. Sales of the Budweiser brand fell by nearly 10% over the past year, the largest decline on record, as younger drinkers have increasingly turned to microbrews and low-calorie products. A-B’s weakness is Miller’s gain. Without improving, Miller claims the top ACSI spot among brewers, unchanged at 83. Molson Coors also remains unchanged, stalled at the bottom of the industry at 81.

And here’s additional analysis from a second release:

Beverages
Customer satisfaction with beer fell from its all-time high in 2009 by 2.4% to 82, driven by a sharp decline for Anheuser-Busch products. The rest of the measured brewers—Miller, Molson Coors, and the aggregate of smaller brands such as Corona, Heineken, and Samuel Adams—held to the same scores received one year ago.

In 2009, a year after its acquisition by Belgian InBev, Anheuser-Busch advanced to its best ACSI score ever and captured the industry lead at a record 84. In 2010, the gain has evaporated as the company lost 4% and slid to 82. The number-one seller of beer in the United States also has struggled with sales of its Budweiser brand. Sales of the brand fell by nearly 10% last year, the largest decline on record, as younger drinkers have increasingly turned to microbrews and low-calorie products.

Miller is a beneficiary of A-B’s plunge. Miller assumes the industry lead in customer satisfaction by standing still at an ACSI score of 83, sharing the top spot with the aggregate of smaller brands (also unchanged). A year ago, Molson Coors slumped to the bottom of the industry. The company is stalled there for a second year at an unchanged score of 81. Value for money remains a challenge, as consumers are increasingly price sensitive and Molson Coors brands tend to be higher priced than many of its competitors’ brands.

Filed Under: Breweries, News Tagged With: Big Brewers, Press Release, Statistics

Beer In Ads #218: Why Is This Fabacher Smiling?

October 18, 2010 By Jay Brooks

ad-billboard
Monday’s ad is for a failed brand from the Jackson Brewery in New Orleans, Louisiana — better known as Jax Brewery. In what I believe began in the late 1960s, Jax launched a brand called Fabacher and had ads with a fake “Andrew Fabacher” who supposedly looked like Andrew Jackson, which is who the brewery had been named for. The brewery was founded in 1890 by Alsatian German immigrant Lawrence Fabacher. It stayed in business during Prohibition by making root beer, other soft drinks and near beer. “By the late 1930s it was sold in all of Louisiana, and parts of Texas, Arkansas, Oklahoma, Tennessee, Mississippi and Alabama.” In 1964, they renovated the brewery and became the “10th largest single-plant brewery in the country, brewing nearly 450,000 barrels of beer annually, [also] making it the largest independent brewery in the South” at that time. The beer ultimately failed and the brewery closed in the mid-1970s. The brewery location is today a shopping mall.

Jax-falbacher

Filed Under: Art & Beer, Beers Tagged With: Advertising, History, Louisiana

« Previous Page
Next Page »

Find Something

Northern California Breweries

Please consider purchasing my latest book, California Breweries North, available from Amazon, or ask for it at your local bookstore.

Recent Comments

  • Bob Paolino on Beer Birthday: Grant Johnston
  • Gambrinus on Historic Beer Birthday: A.J. Houghton
  • Ernie Dewing on Historic Beer Birthday: Charles William Bergner 
  • Steve 'Pudgy' De Rose on Historic Beer Birthday: Jacob Schmidt
  • Jay Brooks on Beer Birthday: Bill Owens

Recent Posts

  • Beer In Ads #5205: Moerlein’s Celebrated Bock Beer, An Easy Winner April 5, 2026
  • Historic Beer Birthday: Fritz Funke April 4, 2026
  • Historic Beer Birthday: Herman Zibold April 4, 2026
  • Beer In Ads #5204: Bock Beer! The First Genuine Bock Of The Season April 4, 2026
  • Historic Beer Birthday: Marcus Rapp April 4, 2026

BBB Archives

Feedback

Head Quarter
This site is hosted and maintained by H25Q.dev. Any questions or comments for the webmaster can be directed here.