

Today’s infographic was originally created for Valentine’s Day earlier this year, by Save on Brew. I picked today to feature it because it’s Women’s Equality Day. Entitled Beers The Ladies Love, it gives tips for beers to give to the lady or ladies in your life. I’m not sure about their list of “10 Top Rated Craft Beer,” and especially the three that are imports, but they’re pretty good beers, at least. And there’s not a fruit beer in the bunch. It’s certainly better than many other attempts at this sort of thing I’ve seen.


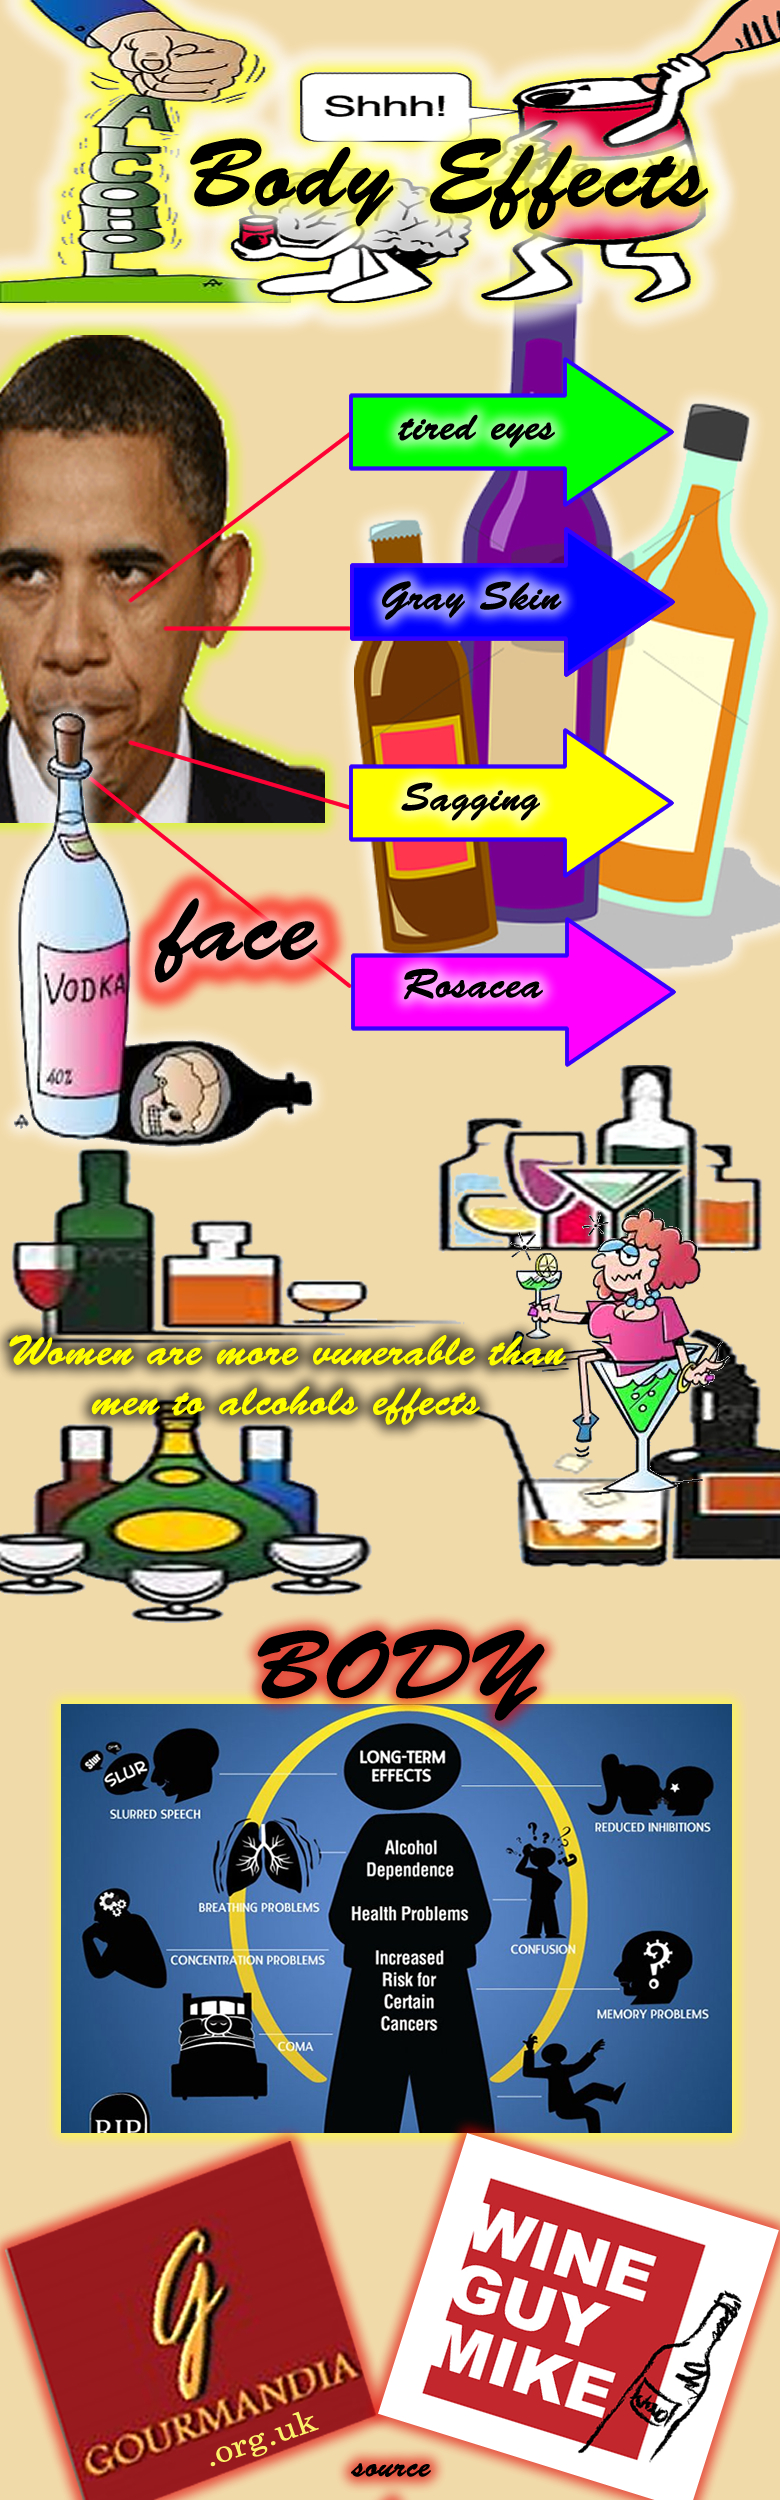
Body Effects Of Alcohol

Today’s infographic crudely shows the Body Effects of Alcohol. Having been posting a new infographic every day for nearly a full eight months, I think this is probably the ugliest and least well-designed infographic to date.
Click here to see the infographic full size.
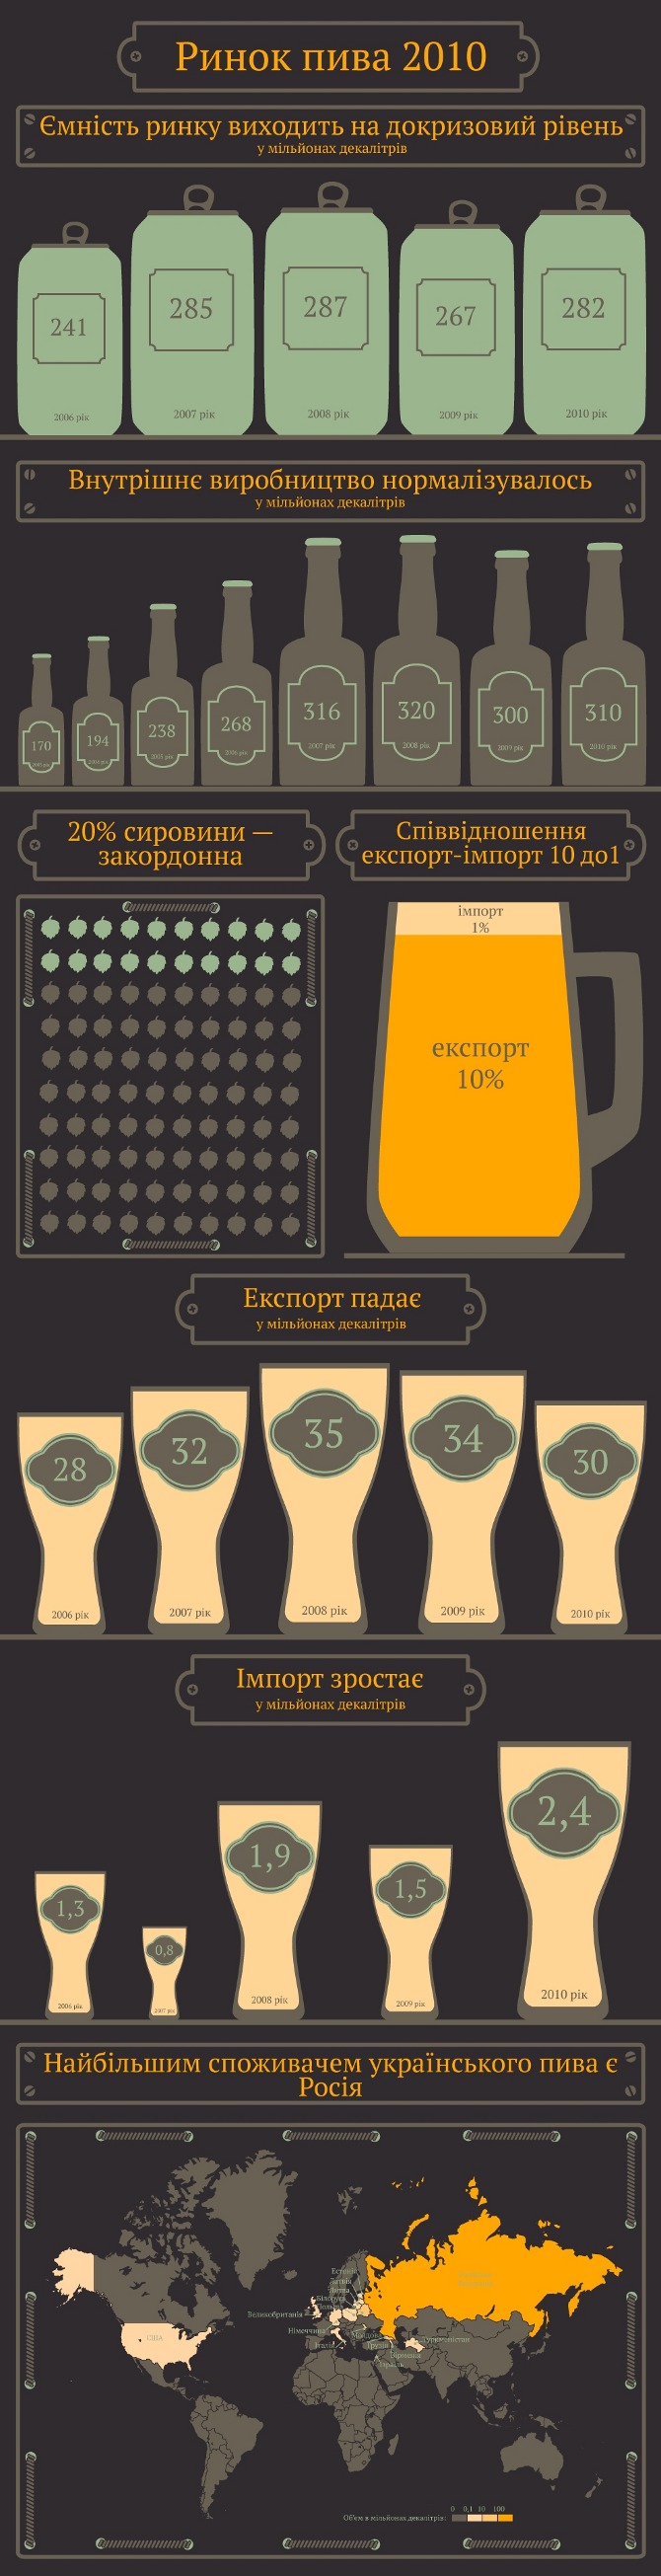
The Beer Market In 2010

Today’s infographic shows the beer market worldwide in 2010, created by Alexander Antoshkiv on March 25, 2011. The language of the infographic is Ukranian — Ринок пива 2010. Інфографіка — and today is their Independence Day.
Click here to see the infographic full size.
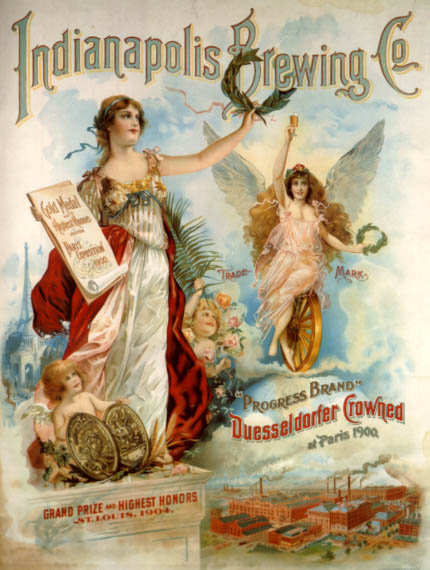
Beer In Ads #961: Indianapolis Brewing Co.

Friday’s ad is an early 20th century ad for the Indianapolis Brewing Co., which was founded in 1887. It’s most popular beer was Circle City Beer, although they eventually closed in 1948. One interesting note, their second president, Albert Lieber, was the maternal grandfather of Kurt Vonnegut Jr.
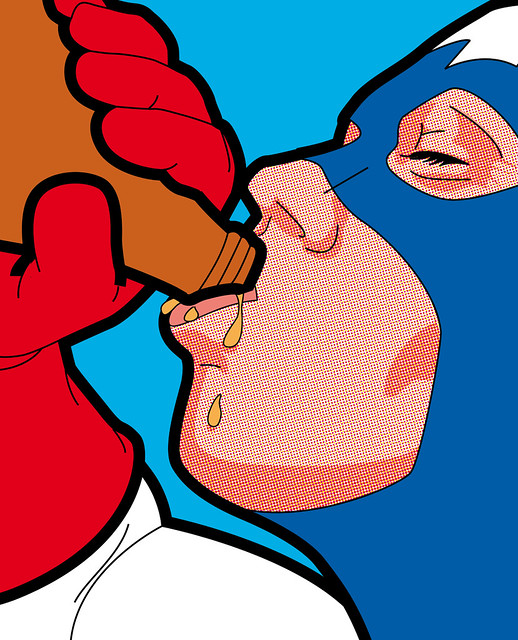
Captain America Drinks Beer

As a long time geek of many stripes, not just beer, I’ve been a longtime reader of comic books. I still regularly read a number of comics, and I’ve gotten Porter into them as well. We have our weekly father/son ritual of going to our local comic book store each Wednesday to pick up the new books. He’s a big fan of Captain America. He loved the movie and started reading the comics shortly after it came out. So an item about some new superhero art in the new issue of Playboy stood out.
A French artist, Grégoire Guillemin, did a series of works under the title “The Secret Life of Heroes,” where he drew many of the classic comic book superheroes, and few other fictional folks, engaged in mundane pursuits, many quite ordinary and few others downright racy and subversive. They remind me of a cross between Roy Lichtenstein and Mel Ramos.
The series includes such images as Wonder Woman scratching her butt, Batman eating a doughnut, Hulk rolling a joint, Superman eating a hamburger, Spiderman brushing his teeth and … well, you get the idea. Go take a look. There’s one more that stood out as a favotite, and that was one of a number featuring Captain America; this one’s entitled Captain Drinks, and features him knocking back a cold bottle of beer. Enjoy.
Cider Is The New Beer [Almost]

Today’s infographic was created by Hack College, and is about hard cider’s recent popularity, comparing it to craft beer, claiming that Cider is the New Beer [Almost].

Click here to see the infographic full size.
The Beer-Smell Gene

Time magazine’s health section had a recent article — The Beer-Smell Gene and Other Ways DNA Drives Our Senses — about how are sense of smell functions, and that not everybody smells things the same way, in the same way that the color blue may look slightly differently to some people (especially those who are color blind). Of course, that’s something any experienced beer judge could tell you. One of the things that you learn, especially when you judge with the same group of people many times, is that everybody’s tolerances and sensitivities to different aromas varies widely. I, for example, am quite tolerant of diacetyl and have to be hit over the head with it to notice it. Mercaptans, on the other hand — that hoppy cat piss — I’m so sensitive of I only need get the glass near my nose to detect it. And we all have those quirks. I’ve judged on the Celebrator Beer News tasting panel with the same group of people for over ten years now, and I can safely predict what my fellow panelists will say about many of the beers we taste.
But what this new study (in the journal Current Biology) found is that “our senses are intimately connected to our DNA, and small variations in our genes can determine whether we are partial to the smell of blue cheese, or can’t stand the taste of cilantro.” The study itself noted. “Analysis of genotype frequencies across human populations implies that variation in sensitivity for these odors is widespread.” This suggests, not surprisingly, that what we find in beer-tasting is true across the broad spectrum of how food smells and tastes, so that in a very real sense none of us taste the same food (or drink) in exactly the same way. Clearly, as a group things do taste similarly to most of us, but there appears to be enough variance that we can’t ever say universally how something should or does taste.
What’s new in this study is that scientists are now able to trace such predispositions to our genomes and are finding patterns based on our DNA and genetic makeup. Interestingly, is also found that “sensitivity is heritable,” meaning how things taste to you is likely similar to your parents and other members of your family. I also love this quote from the abstract, which sums it up neatly. “[E]ach participant possessed one of many possible combinations of sensitivities for these odors, supporting the notion that everyone experiences their own unique ‘flavor world.'” The lead scientist on the study, Jeremy McRae, notes “that when people sit down to eat a meal, they each experience it in their own personalized way.” Which may also explain why I (and presumably you, too) have a taste for beer, while some people simply do not.
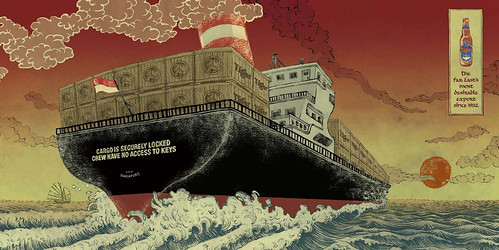
Beer In Ads #960: Cargo Is Securely Locked, Crew Have No Access To Keys
Thursday’s ad is yet another one for Tiger Beer, from a nautical series of beautiful illustrations. This ship has “Cargo Is Securely Locked, Crew Have No Access To Keys” painted on the back of the ship. Damn, and I wanted to open one.
Happy Beer Day Iceland

Today’s infographic is entitled Happy Beer Day Iceland and although Beer Day in Iceland is actually March 1, today in 2006, the first microbrewery there opened. Created by Weemss, it’s mostly a history of beer, and (humorously) they misspelled Guinness.
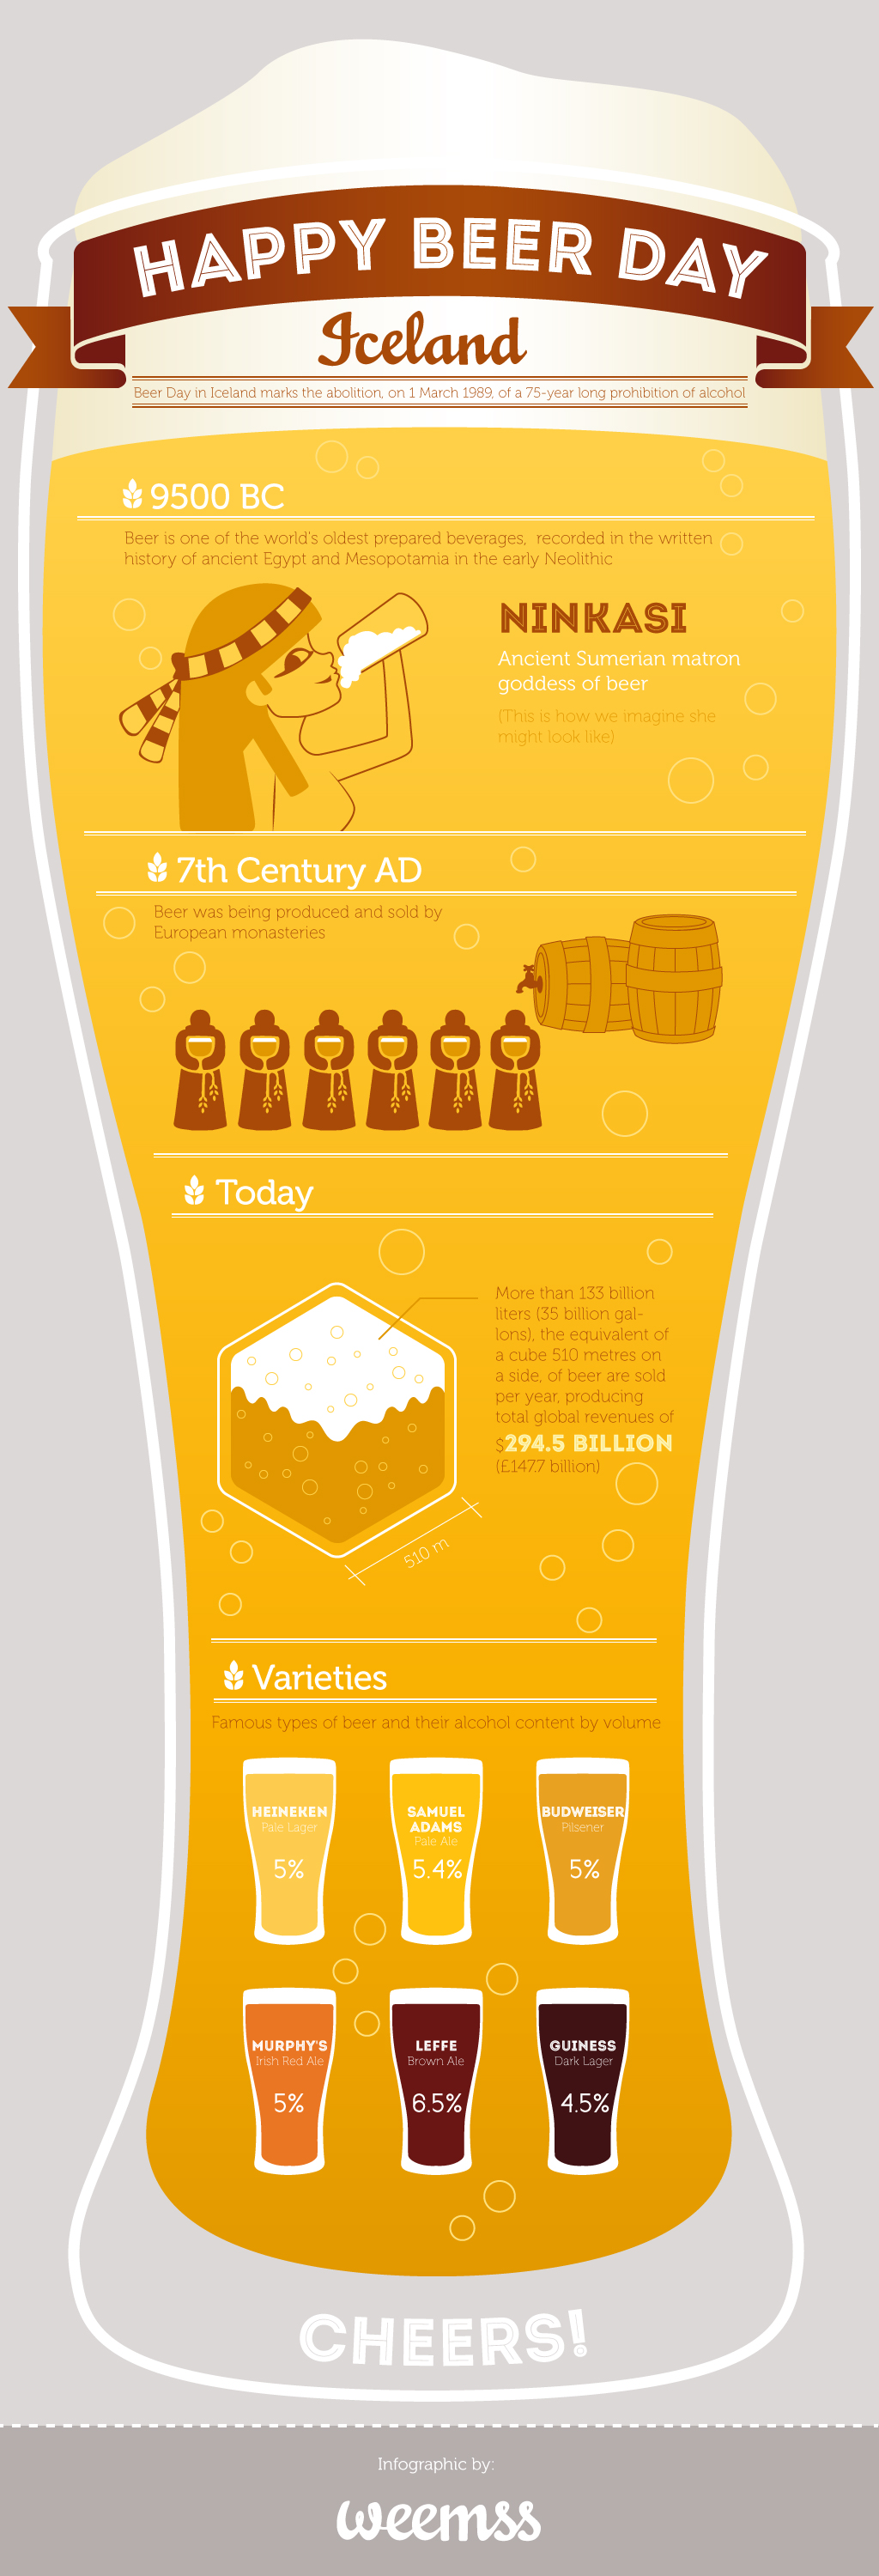
CLick here to see the infographic full size.
Visualizing Alcohol Use
Today’s infographic uses a simple graphic technique for Visualizing Alcohol Use, showing a variety of metrics using the same dot matrix.

Click here to see the infographic full size.