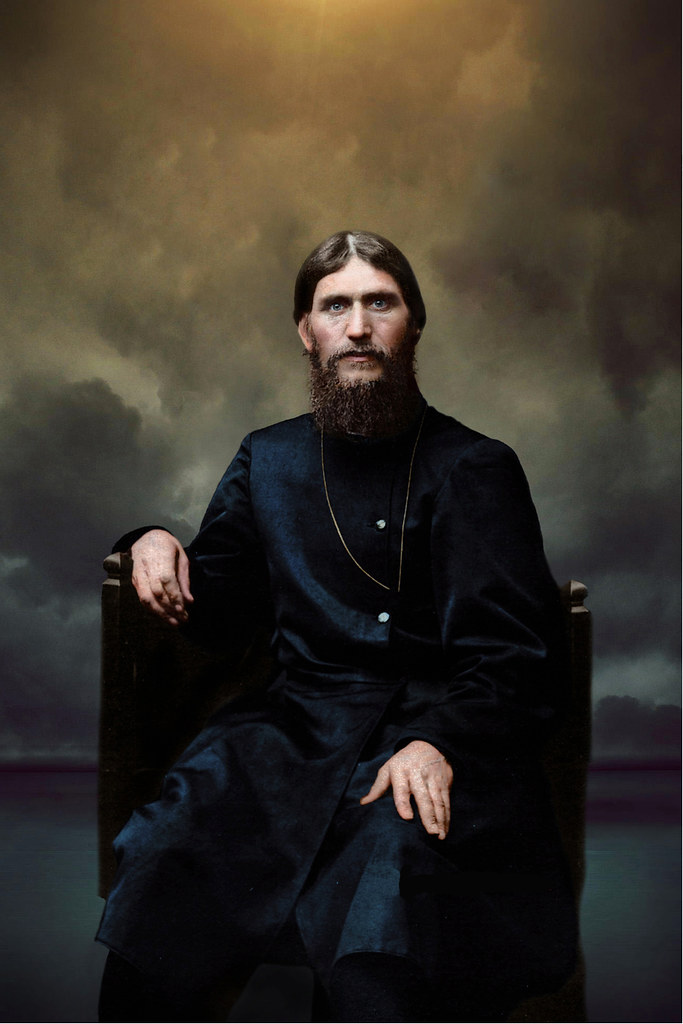
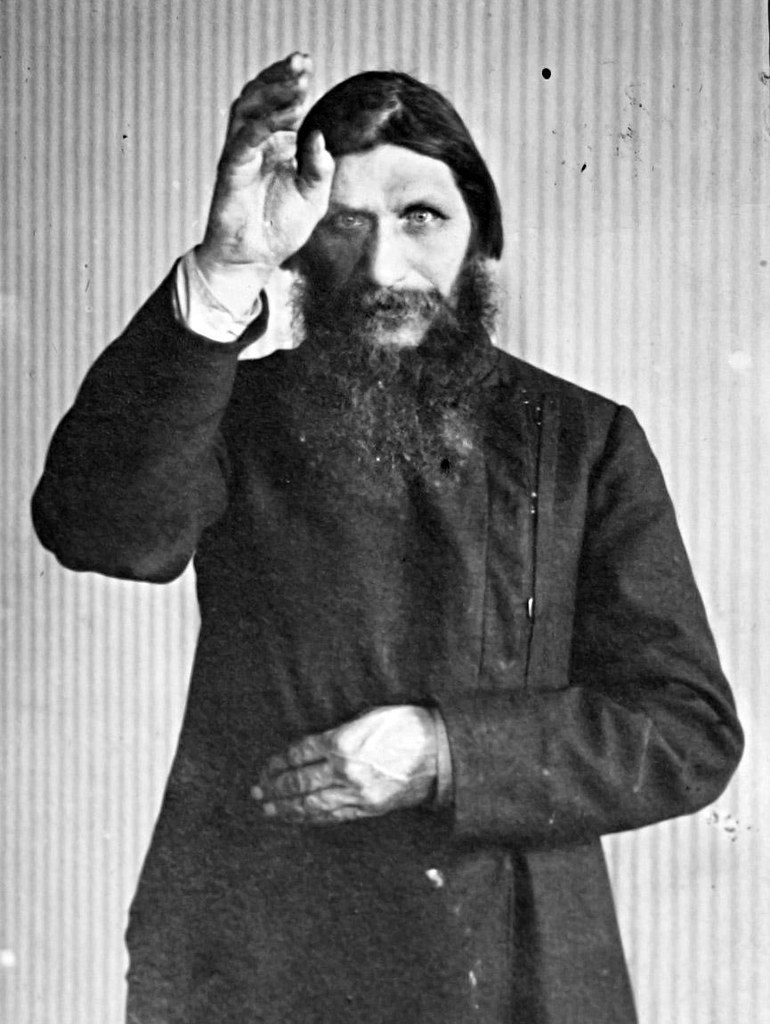
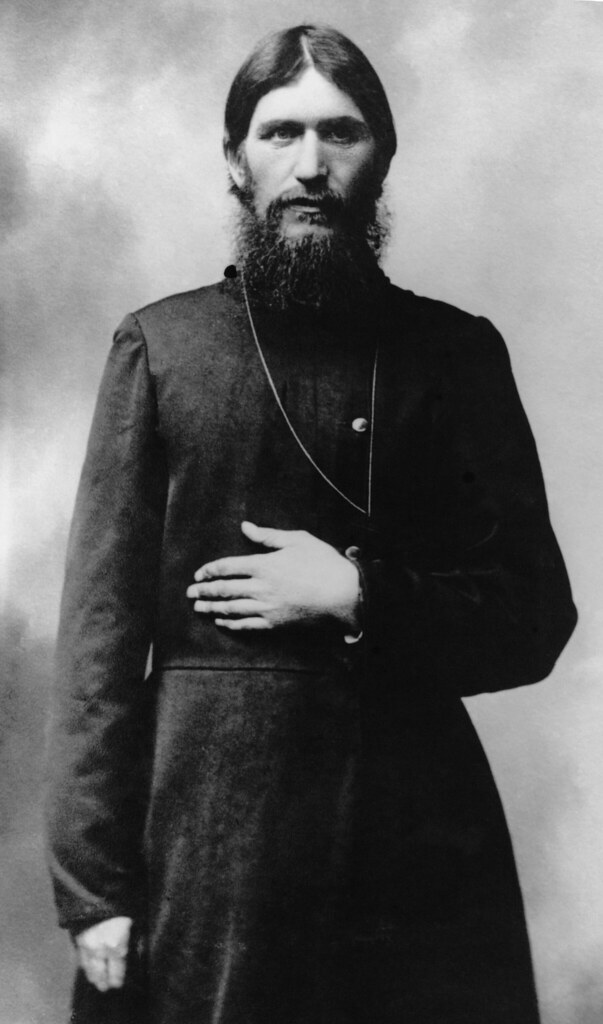
Today is the birthday of Grigori Rasputin (January 21, 1869–December 30, 1916). He “was a Russian peasant, an experienced traveler, a mystical faith healer, and trusted friend of the family of Nicholas II, the last Tsar of the Russian Empire. He became an influential figure in Saint Petersburg, especially after August 1915 when Nicholas took command of the army fighting in World War I. Advising his wife, Alexandra Feodorovna, in countless spiritual and political issues, Rasputin became an easy scapegoat for Russian nationalists, liberals and aristocrats.
There is uncertainty over much of Rasputin’s life and the degree of influence that he exerted over the extremely shy Tsar and the strong-willed Tsarina. Accounts are often based on dubious memoirs, hearsay, and legend. While his influence and position may have been exaggerated by society gossip and his own drunken boasting his presence played a significant role in the increasing unpopularity of the Imperial couple. Rasputin was murdered by monarchists who hoped to save Tsarism by ending his sway over the royal family.”
Here’s his entry from the Encyclopedia Britannica:
Grigory Yefimovich Rasputin, original name Grigory Yefimovich Novykh (born 1872?, Pokrovskoye, near Tyumen, Siberia, Russian Empire—died December 30 [December 17, Old Style], 1916, Petrograd [now St. Petersburg, Russia]), Siberian peasant and mystic whose ability to improve the condition of Aleksey Nikolayevich, the hemophiliac heir to the Russian throne, made him an influential favourite at the court of Emperor Nicholas II and Empress Alexandra.
Although he attended school, the peasant Grigory Yefimovich Novykh remained illiterate, and his reputation for licentiousness earned him the surname Rasputin, Russian for “debauched one.” He evidently underwent a religious conversion at age 18, and eventually he went to the monastery at Verkhoture, where he was introduced to the Khlysty (Flagellants) sect. Rasputin perverted Khlysty beliefs into the doctrine that one was nearest God when feeling “holy passionlessness” and that the best way to reach such a state was through the sexual exhaustion that came after prolonged debauchery. Rasputin did not become a monk. He returned to Pokrovskoye, and at age 19 married Proskovya Fyodorovna Dubrovina, who later bore him four children. Marriage did not settle Rasputin. He left home and wandered to Mount Athos, Greece, and Jerusalem, living off the peasants’ donations and gaining a reputation as a starets (self-proclaimed holy man) with the ability to heal the sick and predict the future.
Rasputin’s wanderings took him to St. Petersburg (1903), where he was welcomed by Theophan, inspector of the religious Academy of St. Petersburg, and Hermogen, bishop of Saratov. The court circles of St. Petersburg at that time were entertaining themselves by delving into mysticism and the occult, so Rasputin—a filthy, unkempt wanderer with brilliant eyes and allegedly extraordinary healing talents—was warmly welcomed. In 1905 Rasputin was introduced to the royal family, and in 1908 he was summoned to the palace of Nicholas and Alexandra during one of their hemophiliac son’s bleeding episodes. Rasputin succeeded in easing the boy’s suffering (probably by his hypnotic powers) and, upon leaving the palace, warned the parents that the destiny of both the child and the dynasty were irrevocably linked to him, thereby setting in motion a decade of Rasputin’s powerful influence on the imperial family and affairs of state.
In the presence of the royal family, Rasputin consistently maintained the posture of a humble and holy peasant. Outside court, however, he soon fell into his former licentious habits. Preaching that physical contact with his own person had a purifying and healing effect, he acquired mistresses and attempted to seduce many other women. When accounts of Rasputin’s conduct reached the ears of Nicholas, the tsar refused to believe that he was anything other than a holy man, and Rasputin’s accusers found themselves transferred to remote regions of the empire or entirely removed from their positions of influence.
By 1911 Rasputin’s behaviour had become a general scandal. The prime minister, P.A. Stolypin, sent the tsar a report on Rasputin’s misdeeds. As a result, the tsar expelled Rasputin, but Alexandra had him returned within a matter of months. Nicholas, anxious not to displease his wife or endanger his son, upon whom Rasputin had an obviously beneficial effect, chose to ignore further allegations of wrongdoing.
Rasputin reached the pinnacle of his power at the Russian court after 1915. During World War I, Nicholas II took personal command of his forces (September 1915) and went to the troops on the front, leaving Alexandra in charge of Russia’s internal affairs, while Rasputin served as her personal advisor. Rasputin’s influence ranged from the appointment of church officials to the selection of cabinet ministers (often incompetent opportunists), and he occasionally intervened in military matters to Russia’s detriment. Though supporting no particular political group, Rasputin was a strong opponent of anyone opposing the autocracy or himself.
Several attempts were made to take the life of Rasputin and save Russia from further calamity, but none were successful until 1916. Then a group of extreme conservatives, including Prince Feliks Yusupov (husband of the tsar’s niece), Vladimir Mitrofanovich Purishkevich (a member of the Duma), and Grand Duke Dmitry Pavlovich (the tsar’s cousin), formed a conspiracy to eliminate Rasputin and save the monarchy from further scandal. On the night of December 29–30 (December 16–17, Old Style), Rasputin was invited to visit Yusupov’s home and, once there, was given poisoned wine and tea cakes. When he did not die, the frantic Yusupov shot him. Rasputin collapsed but was able to run out into the courtyard, where Purishkevich shot him again. The conspirators then bound him and threw him through a hole in the ice into the Neva River, where he finally died by drowning.
The murder merely strengthened Alexandra’s resolve to uphold the principle of autocracy, but a few weeks later the whole imperial regime was swept away by revolution.
Naturally, the reason Rasputin has anything to do with beer, is that Mark Ruedrich, the founder of North Coast Brewing in Fort Bragg, California, named his imperial stout after the “mad monk,” and his Old Rasputin Russian Imperial Stout has become a classic beer, one of the earliest examples of what’s become a very popular style of beer, and, frankly, is still one of the best tasting.

For one of my newspaper columns, in the Fall of 2012, I wrote about imperial stouts, and below is an excerpt from that, the part that tells the story of North Coast’s Old Rasputin:
Happily, you don’t have to go as far as Russia, or even England, to find an imperial stout. We’re very lucky that one of the best Russian Imperial Stouts brewed anywhere is made in nearby Fort Bragg. North Coast Brewing’s Old Rasputin Russian Imperial Stout was also one of the first brewed in America, and was most likely the second (after Bert Grant’s Imperial Stout), which makes it the oldest one still being made. I visited the Fort Bragg brewery last week and watched the latest batch of Old Rasputin being bottled, as I spoke to founder Mark Ruedrich about his beer.
When they opened in 1988, North Coast had a terrific stout they called Old No. 38. But a few years later, Ruedrich decided he wanted to do something different, and noticed that almost nobody else was making the style. Grant’s version also included honey, which is not a traditional ingredient for the style. So he set to work brewing an authentic version of the style, which by that time was even nearly gone in England, too, with very few still making it.
Shortly before its 1994 debut at the pub, Tom Dalldorf, publisher of the “Celebrator Beer News,” happened to be in town visiting the brewery. He recalls Ruedrich handing him a glass and saying. “Here’s a new beer I’m about to release.” Dalldorf recalls seeing its inky black color and asking “don’t you already make a stout?” Mark responded with something like “this is different, just try it.” Like most of us, Tom immediately fell in love with it.
The beer has a definite “wow factor” from the very first sip, with gorgeous milk chocolate, roasted coffee notes and warming sweet flavors from its 9% a.b.v. It’s as bold as they come and infinitely complex, an ever-lasting gobstopper of a beer. It also enjoys near perfect balance. It’s a sipping beer, and changes as it warms in your glass. It’s a not a beer for a pint glass, you’ll want a snifter to get the full aromas of the beer as you slowly sip it by the fire.
One additional fun fact: on the label of Old Rasputin in a quote written in the Cyrillic Russian alphabet. Translated, it’s apparently a traditional Russian saying, or proverb: “a sincere friend is not born instantly.” But if you’re a fan of big beers, you’re love for this beer will almost certainly be instantaneous. For even bigger flavors, if that’s possible, try North Coast’s Old Rasputin XIV, which is their imperial stout aged in bourbon barrels.
The cyrillic text on the label is taken from an old Russian proverb. “A sincere friend is not born instantly.”
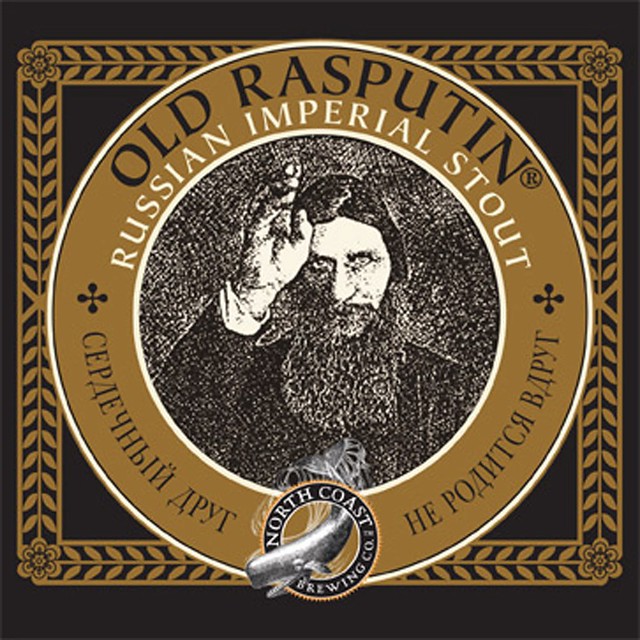
The label also features part of a well-known photograph of Rasputin. And while you find it all over the internet, its origin seems unknown, or at least widely uncredited.
The Smithsonian published a story on the 100th anniversary of his death a few years ago, entitled The Murder of Rasputin, 100 Years Later:
The holy man is he who takes your soul and will and makes them his. When you choose your holy man, you surrender your will. You give it to him in utter submission, in full renunciation.” – Feodor Dostoyevsky, The Brothers Karamazov
The murder of Rasputin, Russia’s infamous “Mad Monk,” is the fodder for a great historical tale that blends fact and legend. But the death of the controversial holy man and faith healer had a combustible effect on the tense state of affairs in pre-revolution Russia. Rasputin was killed on December 30, 1916 (December 17 in the Russian calendar in use at the time), in the basement of the Moika Palace, the Saint Petersburg residence of Prince Felix Yussupov, the richest man in Russia and the husband of the Czar’s only niece, Irina. His battered body was discovered in the Neva River a few days later.
In the decade prior, Rasputin had risen rapidly through Russian society, starting as an obscure Siberian peasant-turned-wandering-holy-man and then becoming one of the most prominent figures in the Czar’s inner circle. Born in 1869 in the village of Pokrovskoye, on the Tura river that flows eastward from the Ural Mountains, where Europe meets Asia in Siberia. He seemed destined for an ordinary life, despite a few conflicts in his youth with local authorities for unruly behavior. He married a local woman, Praskovya Dubrovina, became the father of three surviving children, Maria, Dmitri and Varvara, and worked on his family’s farm.
Rasputin’s life changed in 1892, when he spent months at a monastery, putting him on the path to international renown. Despite his later nickname, “The Mad Monk,” Rasputin never took Holy Orders. Men in Rasputin’s position usually gave up their past lives and relationships but Rasputin continued to see his family – his daughters later lived with him in Saint Petersburg – and support his wife financially.
His religious fervor, combined with an appealing personal charisma, brought Rasputin to the attention of some Russian Orthodox clergymen and then senior members of the Imperial family, who then introduced him to Nicholas II and his wife, Alexandra.
Nicholas wrote to one of his ministers in October 1906, “A few days ago I received a peasant from the Tobolsk district, Grigori Rasputin, who brought me an icon of St. Simon Verkhoturie. He made a remarkably strong impression both on Her Majesty and on myself, so that instead of five minutes our conversation went on for more than an hour.”
The Imperial couple had consulted unconventional spiritual advisors in the past, but Rasputin filled this role by his ability to read their inner hopes and tell them what they wanted to hear. He encouraged Nicholas to have more confidence in his role as czar, and Alexandra found that his counsel soothed her anxieties. By the First World War, Rasputin was also providing political advice and making recommendations for ministerial appointments, much to the dismay of the Russian elite.
Rasputin cemented his relationship with the czar and czarina when he supposedly helped alleviate their only son Alexei’s hemophilia. Rasputin’s alleged healing powers continue to be debated today. The Czar’s sister, Grand Duchess Olga, wrote that she observed Rasputin healing Alexei by kneeling at the foot of his bed and praying; the calming atmosphere that he created in the palace may have assisted with the recovery. Alexandra’s lady-in-waiting, Baroness Sophie Buxhoeveden, thought that Rasputin employed peasant folk medicine used in Siberian villages to treat internal bleeding in horses.
Historians continue to debate Rasputin’s impact on Alexei’s health. In his 2016 book, Rasputin: Faith, Power and the Twilight of the Romanovs, Douglas Smith observes, “Rasputin’s assurances calmed the anxious, fretful mother and filled her with unshakeable confidence, and she, in turn, transferred this confidence to her ailing son, literally willing him back to health.” In addition to increasing confidence in recovery, a key variable may have been Rasputin’s insistence that doctors keep away from Alexei. Medical knowledge was still sparse, even though drugs like aspirin were available for treatment. Unfortunately for Alexei, aspirin, considered a cure-all remedy, had the then-unknown side effect of thinning the blood, which would have exacerbated hemophilia symptoms. French historian Hélène Carrère d’Encausse argued that when Rasputin insisted that remedies prescribed by the doctors be thrown in the fire, the discarded medicine likely would have included aspirin. Rasputin’s insistence that the doctors leave him alone would have improved his condition and appeared to create a miraculous improvement in his symptoms.
Rasputin presented himself in the Imperial Court as holy man, despite no formal affiliation with the Russian Orthodox Church, and spoke as a self-appointed representative of the peasantry, but his behavior away from court offered a different portrait. His drunkenness and affairs with women of all social backgrounds, from street prostitutes to society ladies, scandalized the public. Rasputin appeared to bask in his fame, showing off shirts embroidered for him by the Empress and inviting her friends and servants to his home in Prokovskoye. (Rasputin’s wife appeared untroubled by his infidelities, commenting “He has enough for all.”)
The press, unshackled thanks to rights granted to them by Nicholas II in 1905, spread lurid tales about Rasputin both within Russia and abroad. Rumors about Rasputin’s influence over the Czarist regime spread throughout Europe. Petitioners, believing that Rasputin lived with the Imperial family, mailed their requests to “Rasputin, Czar’s palace, Saint Petersburg.”
Soldiers on World War I’s Eastern front spoke of Rasputin having an intimate affair with Alexandra, passing it off as common knowledge without evidence. As the war progressed, outlandish stories expanded to include Rasputin’s supposed treason with the German enemy, including a fantastical tale that he sought to undermine the war effort by starting a cholera epidemic in Saint Petersburg with “poisoned apples imported from Canada.” What the public thought they knew about Rasputin had a greater impact than his actual views and activities, fueling demands that he be removed from his position of influence by any means necessary.
Until he murdered Rasputin, Felix Yussupov lived a comparatively aimless life of privilege. One of Nicholas II’s daughters, also named Grand Duchess Olga, worked as a nurse during the war and criticized Yussupov’s refusal to enlist, writing to her father, “Felix is a ‘downright civilian,’ dressed all in brown…virtually doing nothing; an utterly unpleasant impression he makes – a man idling in such times.” Plotting Rasputin’s murder gave Yussupov the opportunity to reinvent himself as a patriot and man of action, determined to protect the throne from a malign influence.
For Yussupov and his co-conspirators, the removal of Rasputin could give Nicholas II one last chance of restoring the reputation and prestige of the monarchy. With Rasputin gone, the czar would be more open to the advice of his extended family, the nobility and the Duma and less dependent on Alexandra. There was hope that he would return from military headquarters and once again govern from Saint Petersburg.
The most well-known account of Rasputin’s murder was the one that Yussupov wrote in his memoirs, published in 1928. Yussupov claimed to have invited Rasputin to his palace to meet his wife Irina (who was in fact away at the time) and then served him a platter of cakes and numerous glasses of wine laced with potassium cyanide. To Yussupov’s astonishment, Rasputin appeared to be unaffected by the poison. A desperate Yussupov borrowed the revolver of the Grand Duke Dmitri, the czar’s cousin, and shot Rasputin multiple times, but was still unable to kill him. According to the memoir, “This devil who was dying of poison, who had a bullet in his heart, must have been raised from the dead by the powers of evil. There was something appalling and monstrous in his diabolical refusal to die.” There was reputedly water in his lungs when his remains were discovered, indicating that he had finally died by drowning.
Yussupov’s account of Rasputin’s murder entered popular culture. The lurid scene was dramatized in numerous films about Rasputin and the Romanovs and even made it into a 1970s disco hit by Boney M., which included the lyrics “They put some poison into his wine…He drank it all and said, ‘I feel fine.’”
Rasputin’s actual murder was probably far less dramatic. His daughter Maria, who fled Russia after the Revolution and became a circus lion tamer billed as “the daughter of the famous mad monk whose feats in Russia astonished the world,” wrote her own book in 1929 that condemned Yussupov’s actions and questioned the veracity of his account. She wrote that her father did not like sweets and never would have eaten a platter of cakes. The autopsy reports do not mention poison or drowning but instead conclude that he was shot in the head at close range. Yussupov transformed the murder into an epic struggle of good versus evil to sell books and bolster his own reputation.
The responses from the public were mixed, reflecting Rasputin’s checkered reputation. The elite, from whence Yussupov and his co-conspirators came, rejoiced and applauded the killers when they appeared in public. The peasantry mourned Rasputin as one of their own, seeing the murder as one more example of the nobility controlling the Czar; when a peasant rose to a position of influence with the Czar, he was murdered by wealthy men.
To the dismay of Yussupov and his co-conspirators, Rasputin’s murder did not lead to a radical change in Nicholas and Alexandra’s polities. To the emergent Bolsheviks, Rasputin symbolized the corruption at the heart of the Imperial court, and his murder was seen, rather accurately, as an attempt by the nobility to hold onto power at the continued expense of the proletariat. To them, Rasputin represented the broader problems with czarism. In the aftermath of the Russian Revolution, Provisional Government leader Alexander Kerensky went so far as to say, “Without Rasputin there would have been no Lenin.”
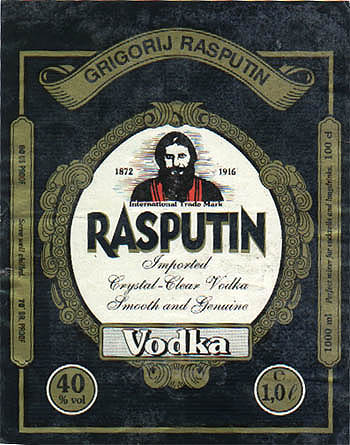
And, apropos of nothing, there’s apparently a commercial vodka called “Rasputin.”