
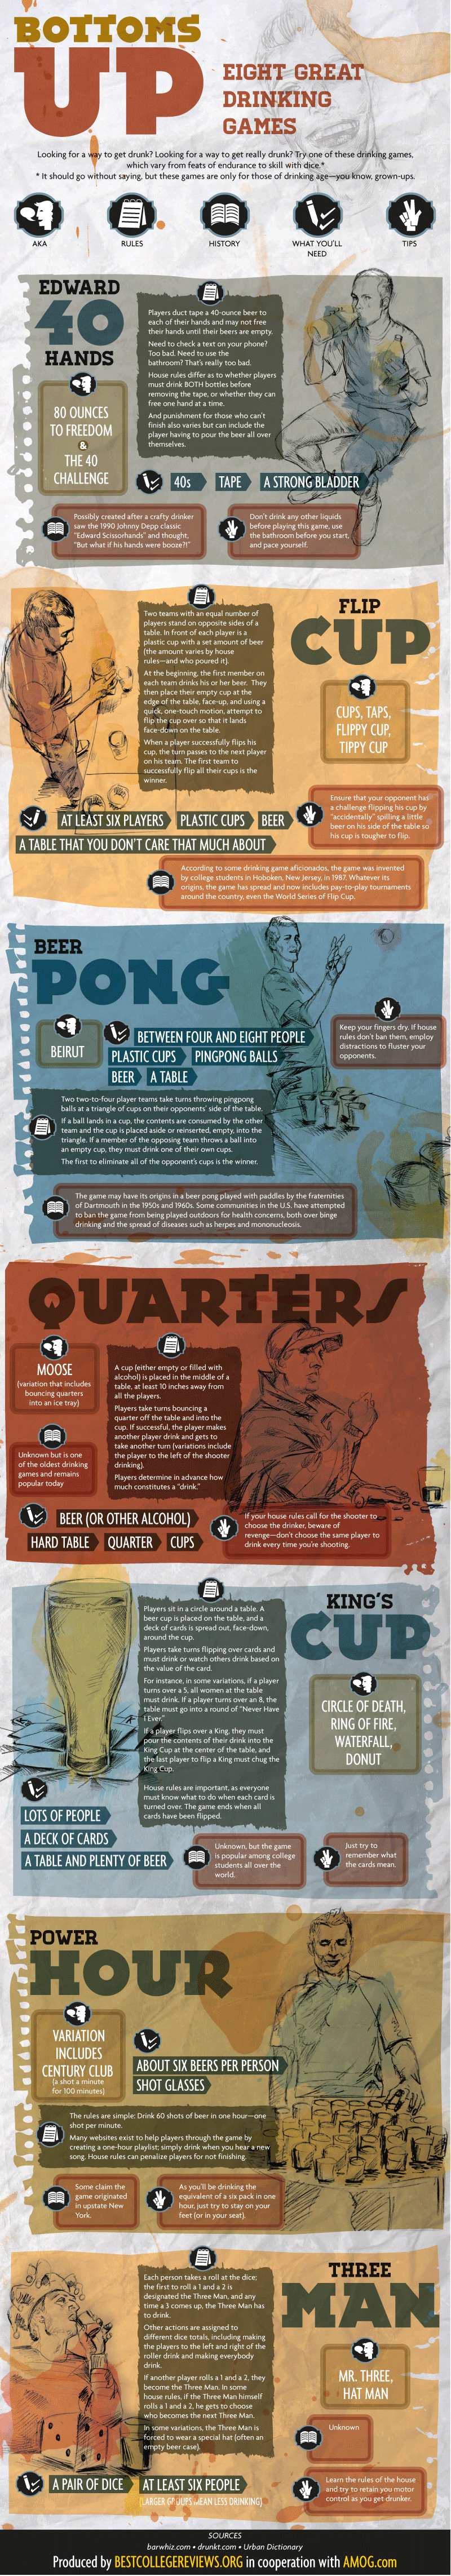
Today’s infographic, entitled “8 Great Drinking Games,” was created by Best College Reviews, and also includes the rules written out below the infographic.
Click here to see the infographic full size.

Today’s infographic, entitled “8 Great Drinking Games,” was created by Best College Reviews, and also includes the rules written out below the infographic.
Click here to see the infographic full size.

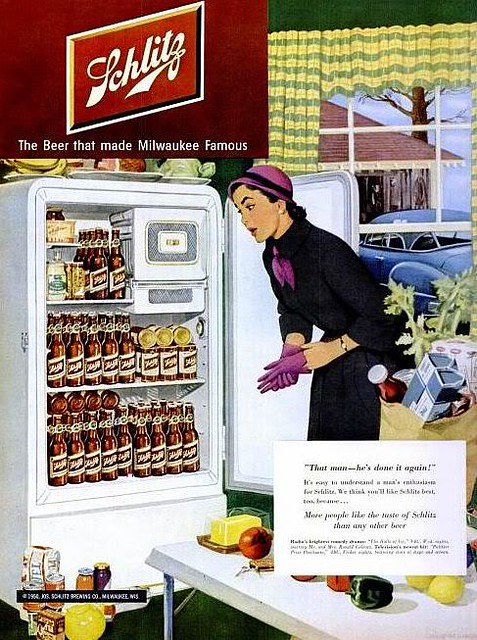
Friday’s ad is for Schlitz, from 1950. In the wonderful illustration, it appears that a woman has discovered that her husband has emptied the refrigerator of food and filled it with Schlitz beer. Surveying the scene with a new bag of groceries on the table, not to mention other food scattered about the kitchen, all she can do is exclaim. “That Man — He’s Done It Again!”

Today’s infographic is a map of the world showing the change in worldwide beer comsumption from 2008 to 2009, when Asia became the biggest consumer of beer. The chart comes from a 2010 story in the Economist, All Pints East.
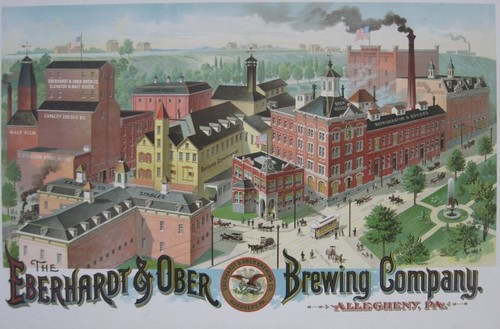
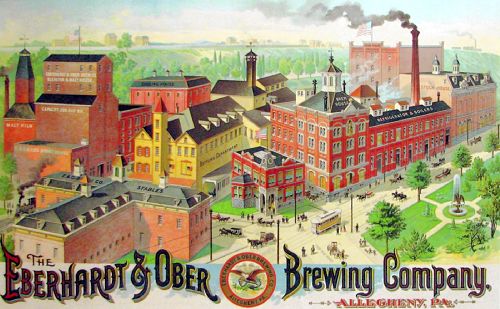
Thursday’s ad is for the Eberhardt & Ober Brewing of Allegheny, Pennsylvania, from around 1890. While the brewery closed in the 1950s, some of the buildings are still in use by the craft brewery Penn Brewery. They even auctioned one of the original lithographs in 2008.
And here’s another version that’s a little brighter.
Today’s infographic is a travel guide to visiting English breweries and other beer destinations by train, entitled the Rail Ale Trail. It was created last year by Red Spotted Hanky, a UK travel website.
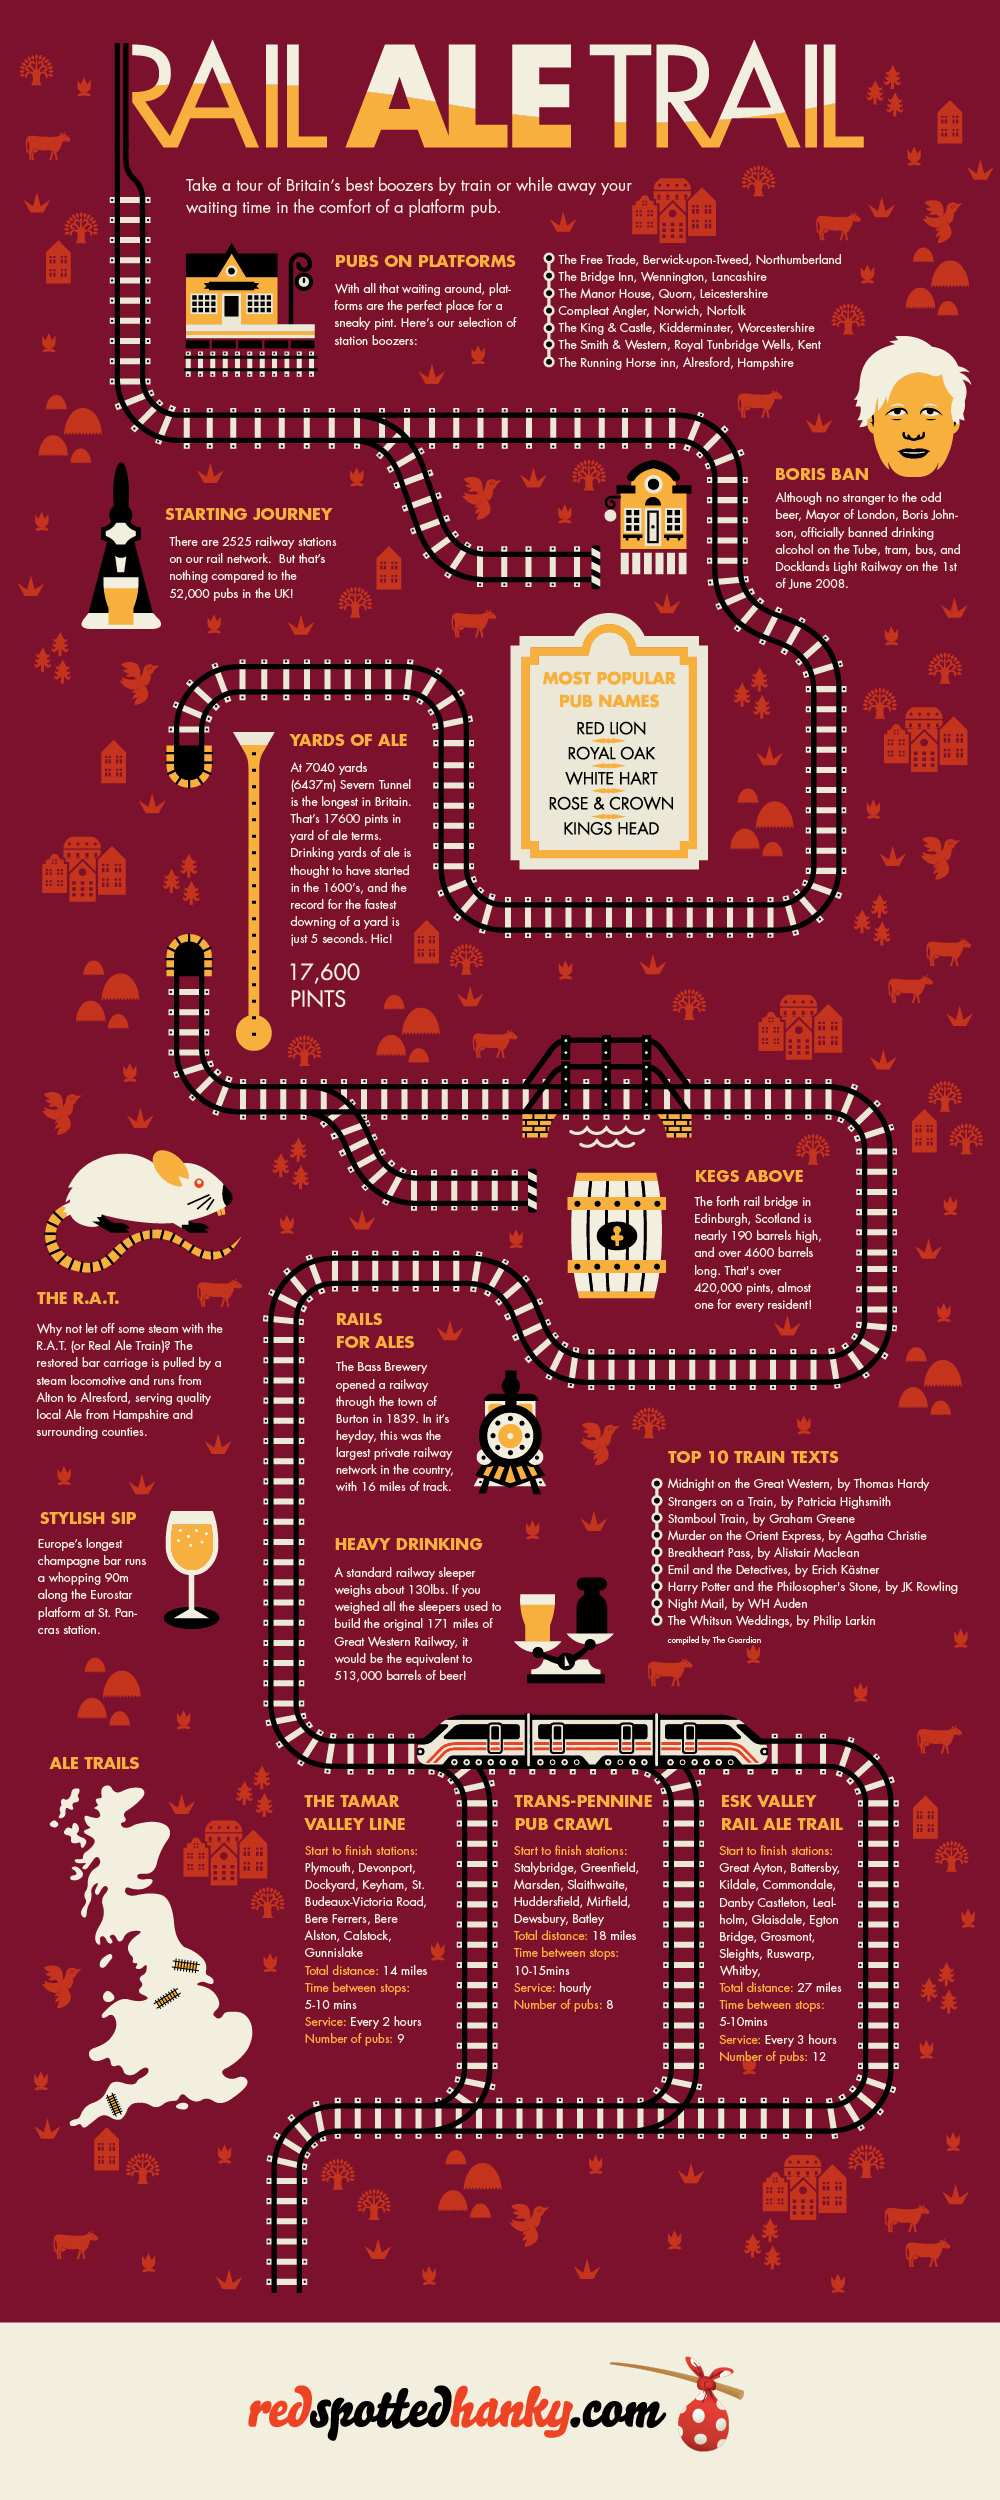
CLick here to see the infographic full size.
Wednesday’s ad is for Carling’s Red Cap Ale, from 1950. The ad is graduation-themed, with a disembodied Ethel Merman wearing a mortarboard hat with a tiny red cap on top. I love the way they characterize the beer as a “light-hearted ale.” For some reason that sounds better than light-bodied.

![]()
Today’s infographic is about beer from the Czech Republic. Created by Jan Turnovec for Denik, a national newspaper. If only I could read Czech.
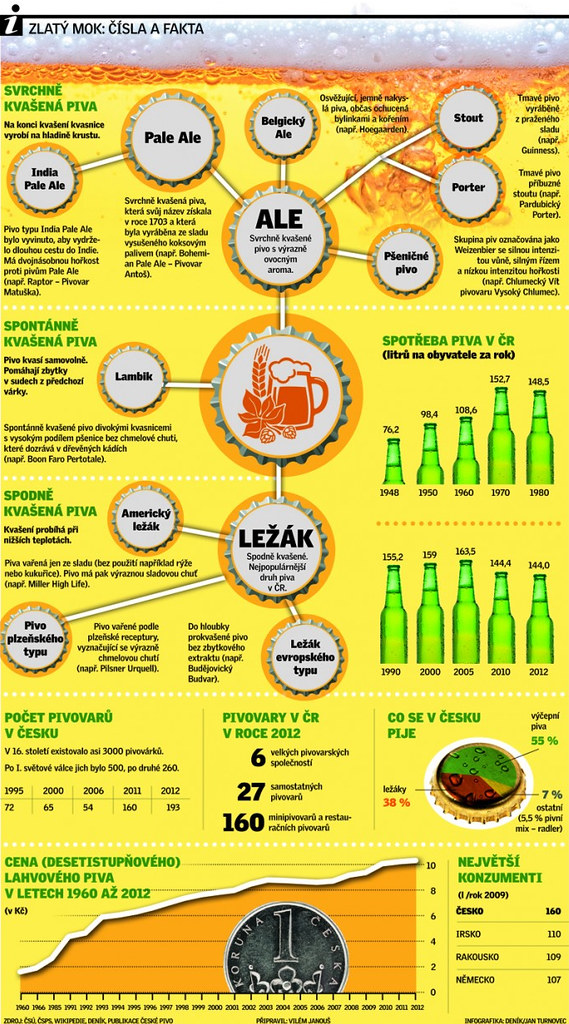
Clic here to see the infographic full size.
Tuesday’s ad is for the C.L. Centlivre Brewing Co. of Fort Wayne, Indiana, from around 1880. It’s another one of those wonderful illustrations of the industrial magnificence that old breweries used to do back in the 19th century. It was done by the Henderson Lithographing Co. of Cincinnati, Ohio.


Dave Burkhart, Anchor Brewing‘s resdient historian, put together a great little video all about the connection between beer and baseball in San Francisco, along with its rich history, of course. The video brings to mind this great quote, by Peter Richmond. “Beer needs baseball, and baseball needs beer — it has always been thus.”
![]()
Today’s infographic is an interactive one called The Hopometer, which is subtitled “Visualising beer strength and bitterness.” It was created by Peter G in London, whose blog Paint by Numbers is used for “focusing on [his] experiments with data visualisation predominantly using Tableau Software.” That’s why you really need to look at it on his page.
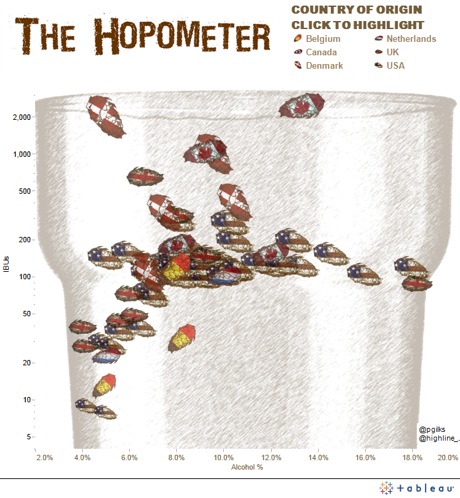
Click here to see the interactive original version of the Hopometer.