

AdAge posted an interesting video today, it’s an interview with Anheuser-Busch InBev Vice President Digital Marketing for North America, Lucas Herscovici, where he discusses how ABI “measures its results in social media. It was taped prior to his presentation at the Ad Age Digital Conference, which took place yesterday in San Francisco.
Worldwide Alcohol Consumption Cartogram

Today’s infographic is a type of map known as a cartogram, which takes a standard map and distorts the land masses based on a particular data point. It was created by World Mapper, a website that’s done close to 700 cartograms showing a variety of data in this way.
Here’s the standard map, showing each country based on their land mass. Actually, a Mercator projection is the one most of us are familiar with, but that map distorts the size of land which shows the round Earth as a flat map that’s drawn as if you took the globe apart and laid it down, making the land closest to the North and South poles look much bigger than they are in reality. The standard map for World Mapper is known as a Gall–Peters projection , which shows the land masses much closer to their actual size.

Click here to see the map full size.
What a cartogram does is take their standard map and distort the land masses of nations on purpose, to show the differences in the data more clearly by how much it’s been distorted from the original. For example, here’s the same map, but distorted to show the world by population.
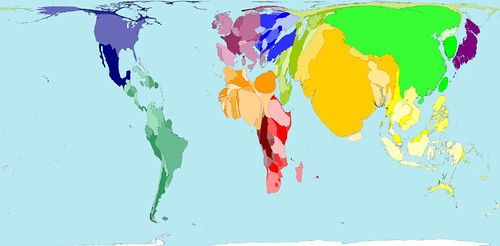
Click here to see the map full size.
So here’s the same map again, but this time distorted to show absolute alcohol consumption, based on data from 2001.
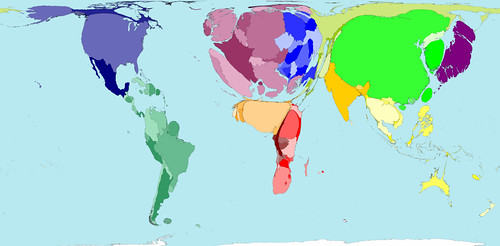
Click here to see the map full size.
Here’s some more information on the alcohol consumption map.
The average Western European drinks over a third more alcohol than the average person living in any other region. The lowest alcohol consumption per person is found in Southern Asia, where on average people drink less than a third of the average consumption elsewhere.
In some territories there is practically no alcohol consumption. Many Middle Eastern and Northern African territories are not visible on the map for that reason. In contrast, China, the United States and the Russian Federation have the largest areas on the map, because the most alcohol is consumed there by large populations.
If you’re curious about the debate surrounding different map projections, take a peak at the Gall-Peters – Mercator projection Debate, a closer look at the Gall-Peters projection at the Power of Cartography, and a good overview of different projections at One world, many faces: A brief look at map projections.
The Legal Drinking Age Around The World

Today’s infographic is a world map, showing the Legal Drinking Age Around the World. The darker the color, the higher the age at which you’re legally allowed to drink alcohol. Notice that America is one of the darkest regions on the map. Sheesh, sometimes we’re backwards.
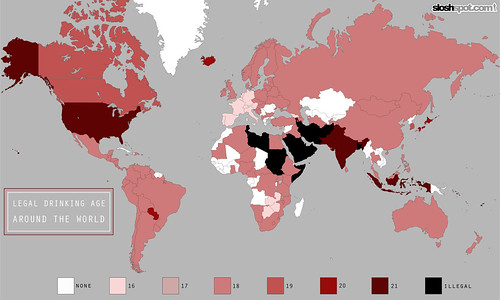
Click here to see the map full size.
Brewery Caves

The original beer cellars, of course, were caves, where brewers could count on the temperatures staying low enough. I got an e-mail the other day from Dagmar Suarez (not his real name) who writes Detritus of Empire about his series of blog posts on abandoned brewery caves. As a former medical doctor in Wisconsin, most of the more than two dozen posts on old beer caves are located in the Great Lakes area, but it’s a fascinating look back to a time when brewers had to be resourceful to meet their cooling needs.
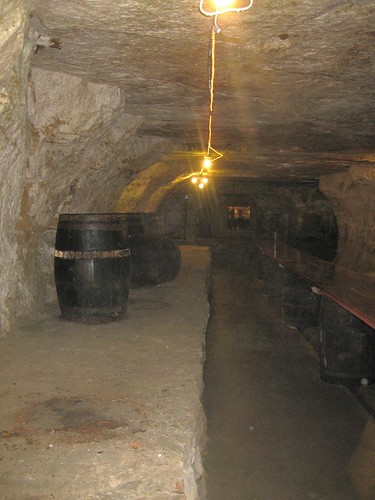
A brewery cave in Stillwater, Minnesota from the 1870s.
The Original Midget Brewery

Last week, Boak & Bailey tweeted about what must have been one of the earliest commercial nanobrewery systems. I tried to find out more about the Midget Brewery, though there’s scant information available on the interwebs. Here’s what I found. In 1936, page 30 of the February issue of Popular Science featured a little piece about the Midget Brewery, developed for R&D in Great Britain.
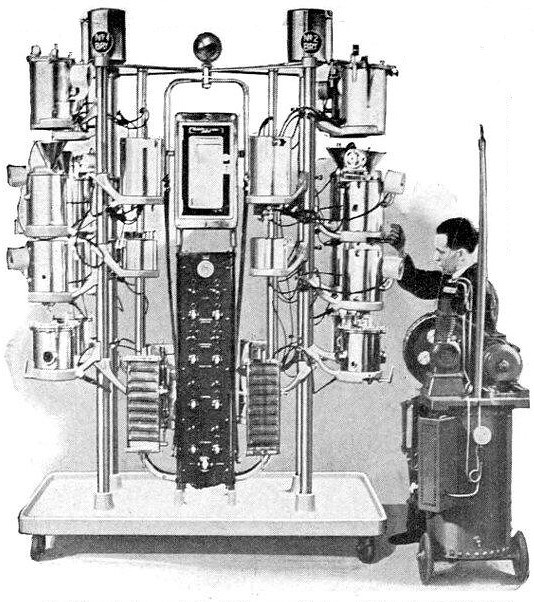
Here’s the full text that accompanied the photograph:
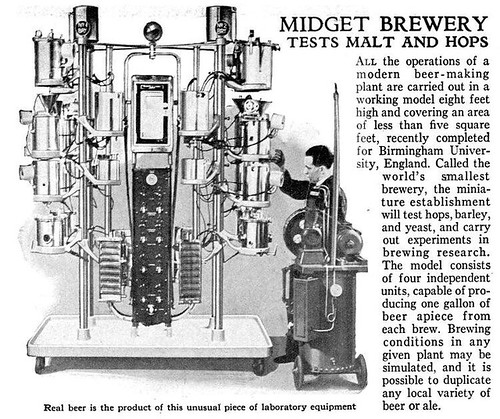
All the operations of a modern beer-making plant are carried out in a working model eight feet high and covering an area of less than five square feet, recently completed for Birmingham University, England. Called the world’s smallest brewery, the miniature establishment will test hops, barley, and yeast, and carry out experiments in brewing research. The model consists of four independent units, capable of producing one gallon of beer apiece from each brew. Brewing conditions in any given plant may be simulated, and it is possible to duplicate any local variety of beer or ale.
Who Exports Beer?
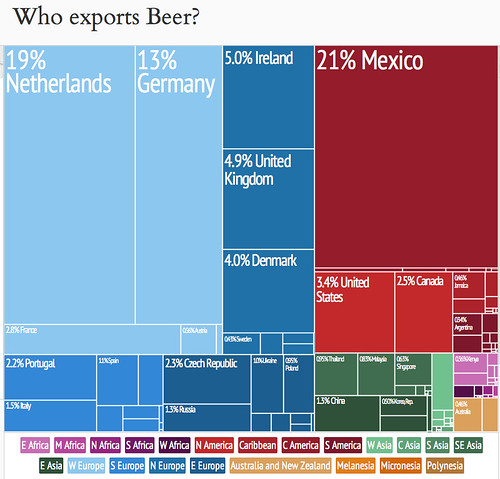
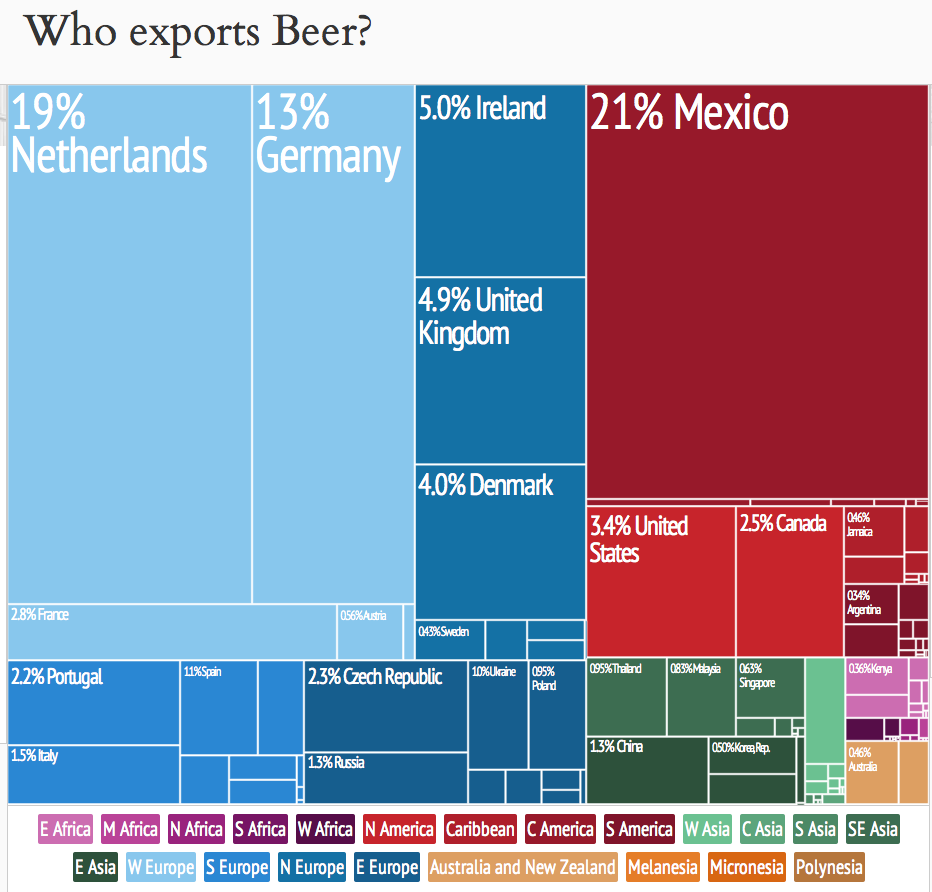
Today’s infographic is an interesting treemap created by the Observatory of Economic Complexity, a collaboration between M.I.T. and Harvard. This one, contrasting yesterday’s, shows the amount of beer exported by the nations of the world, with the size of their relative amount of exporting shown by the size of the rectangle.

NAGBW Beer Writing Awards Announced

The North American Guild of Beer Writers is pleased to announced the winners of the 2013 Beer Writing Contest. Awards in six categories were announced earlier today at the McNichols Civic Center Building in Denver, Colorado. The awards were for work that was published between July 1, 2012 and June 30, 2013. This was the first awards for the newly reformed writer’s guild, who received just over 100 entries for this year’s awards. Congratulations to each of the winners.
Best Brewspaper/Free Zine Writing
1. Randy Clemens, “Drinking on the Job: Traditional Belgian & French Farmhouse Ales”
2. Brian Yaeger, “An Oral History of Widmer Hefeweizen”
3. Ken Weaver, “The Big Show: Local brewers prepare for the Great American Beer Festival”
Best Beer Blog
1. Oliver Gray, Literature and Libation
2. Alan McCormick, Growler Fills: Craft Beer Enthusiasm
3. Terry Lozoff, Drink Insider
Best Beer and Food Writing
1. Ken Weaver, “Genesis of a Beer Dinner”
2. Kurt Epps, “Now Batting: Ted Williams at Tapastre”
3. No award
Best Newspaper (Paid Circulation) Writing
1. Evan Rail, “In London, A Flood of Pints”
2. Josh Noel, “The Best Beer in the World”
3. No award
Best Magazine Writing
1. Martin Thibault, “Top Secret – The Farmhouse Brewing Traditions of Lithuania”
2. Joe Stange, “Alt Reality”
3. Aleszu Bajak, “Brewing in Thin Air”
Best Book
1. Tim Webb and Stephen Beaumont, “The World Atlas of Beer”
2. Janet Fletcher, “Cheese and Beer”
3. Tom Acitelli, “The Audacity of Hops”

Animated Beer Production In The Czech Republic

Today’s infographic is slick animated graphic showing the brewing process. It’s a pretty cool graphic. There’s different panels for brewing, basic types of beer, production by European countries, and some beer history. The only thing that would make it cooler would be if I could read Czech. But click on the image below to see it in all its glory.
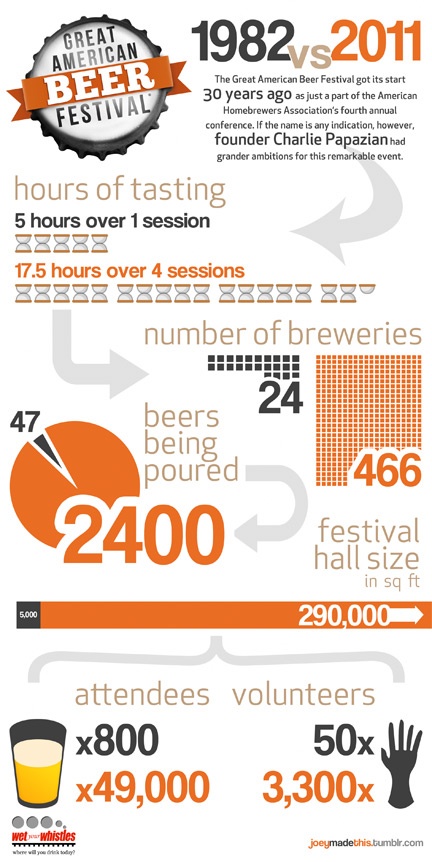
GABF 1982 Vs. 2011

Today’s infographic, on the first day of this year’s Great American Beer Festival, is a comparison of statistics from GABF in 1982 vs. 2011, two years ago on the festival’s 30th anniversary. It was created by Joey McDaniel, one-half of the Bay Area blog Wet Your Whistles.
The Magnificent Multitude of Beer

Today’s infographic is the latest from Pop Chart Lab, this time it’s The Magnificent Multitude of Beer. The poster features “ales and lagers into over 100 delicious styles from hoppy IPAs to fruity lambics, and including over 500 individual beers as notable examples of each style as well as glassware recommendations. The Magnificent Multitude of Beer captures the proud work of hundreds of breweries around the world, clocks in at a staggering 60 inches by 40 inches, and is the perfect finishing touch for your man cave or lady lair.” You can buy the poster for $90 at Pop Chart Lab.

Click here to see the poster full size.